
01 The Problem
Something was wrong — but nothing looked broken
We were building the motor controller for our project. The hardware was running, the code was compiling, and the control loop was spinning the motor. On paper, everything was fine.
But in reality:
- Current readings were noisy
- Motor control felt unstable
- The motor sounded rough at steady speed
- Tuning the PI controller did not help
We tried the obvious fixes — more filtering, tweaking gains, averaging ADC samples. Nothing worked. The noise kept coming back.

02 What We Found on The Logic Analyser
The problem was not what we measured — it was when
We connected the Saleae Logic Analyzer to the PWM output pins and decoded the signals using PulseView. What we saw made the problem obvious.
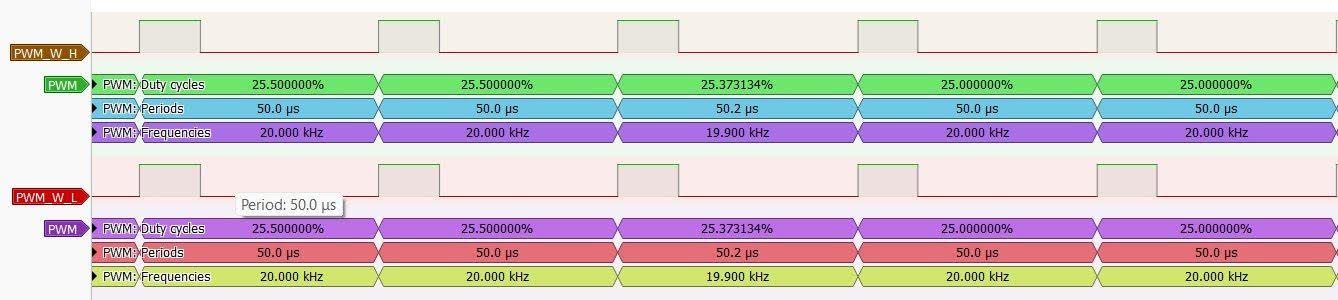
Fig 1 — PulseView capture showing PWM_W_H (high-side) and PWM_W_L (low-side) for Phase W at 20 kHz. Both signals show ~25% duty cycle with 50 µs period — but notice the pulse starts from the LEFT edge of every period. This is edge-aligned PWM, not center-aligned. The ADC is sampling near the switching edge — exactly the noise source we were chasing.
What the measurements showed:
- Period: 50 µs on both channels — frequency is correct at 20 kHz
- PWM_W_H duty: ~25.5% — high-side Phase W switch
- PWM_W_L duty: ~25.5% — low-side Phase W switch (complementary)
- Problem: both pulses start from the LEFT edge of every period — edge-aligned behaviour
- The ADC trigger was firing near this edge — right in the middle of the switching noise
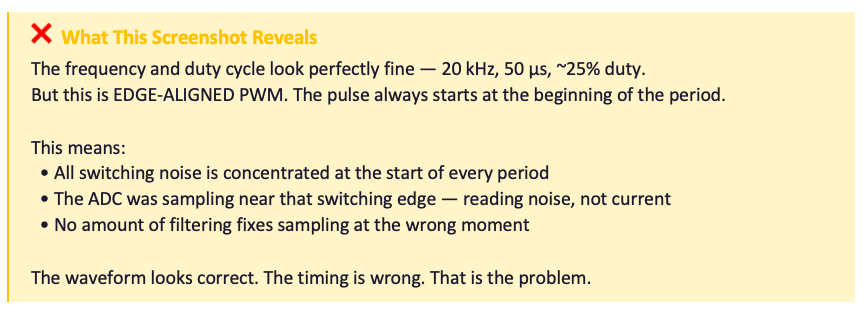
03 The Concept
What is Center-Aligned PWM?
PWM (Pulse Width Modulation) controls a switch by turning it ON and OFF at high speed. The ratio of ON time to total period is the duty cycle. There are two ways to position the ON pulse inside a period — and that choice has a major impact on when switching noise occurs.
Edge-Aligned PWM
The pulse always starts from the same edge — the beginning of the period. The counter counts from 0 up to the period value and then resets. All switching noise is concentrated at the start, and the ADC ends up sampling right next to it.
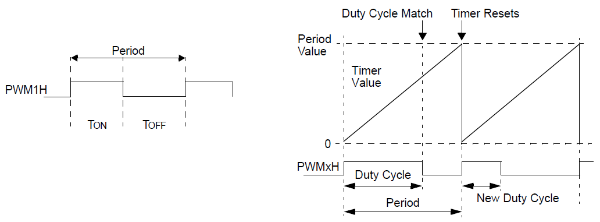
Fig — Edge-aligned PWM: sawtooth counter, pulse starts at the left edge every period.
Center-Aligned PWM
The pulse is placed symmetrically around the midpoint. The counter counts up to the peak and then back down, forming a triangle. The two switching edges are pushed to both sides, leaving a guaranteed quiet zone at T/2 — exactly where the ADC should sample.
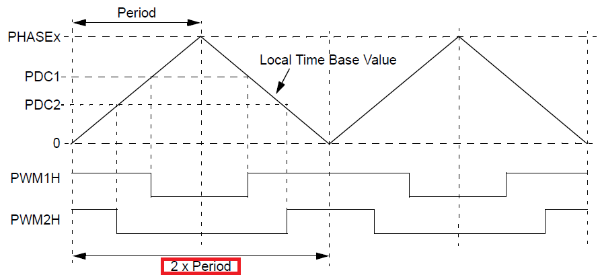
Fig — Center-aligned PWM: triangle counter, pulse centred at T/2. ADC trigger fires at the quiet zone in the middle. SR1 = (P−D)/2 sets the first edge, SR0 = SR1+D sets the second — both equidistant from T/2.
Side-by-side overview
The combined diagram below shows both waveforms together — counter shape, noise zones, ADC trigger placement, and the formula — for a quick comparison:
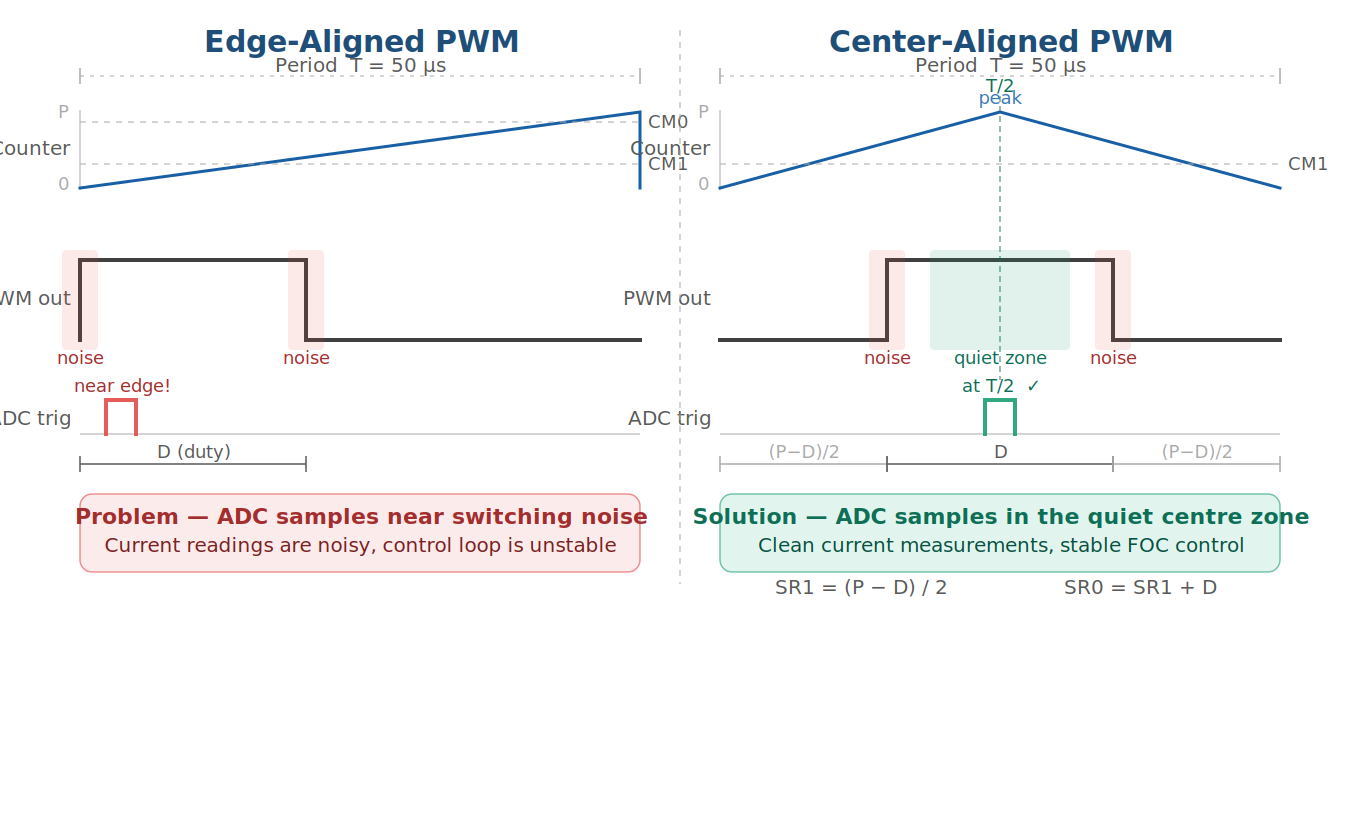
Fig — Side-by-side comparison. Left: edge-aligned, ADC near noise. Right: center-aligned, ADC at quiet T/2 zone.
Inside the GTM — how it actually looks in hardware
This is the actual GTM ATOM timing diagram from the reference specification. It shows how CM0, CM1, and the CN0 counter interact to produce the output waveform:
![Fig 2 — GTM ATOM timing diagram (from GTM IP specification). CN0 counter ramps up and is triggered to count down by TRIG_[x-1]. CM1 and CM0 compare values define the two output edges, creating center-aligned behaviour.](https://vayavyalabs.com/wp-content/uploads/2026/08/unnamed-1.jpg)
Fig 2 — GTM ATOM timing diagram (from GTM IP specification). CN0 counter ramps up and is triggered to count down by TRIG_[x-1]. CM1 and CM0 compare values that define the two output edges, creating center-aligned behaviour.
What this diagram shows:
- CN0 is the running counter — it ramps up, then a trigger event causes it to count down
- CM1 is crossed on the way up — this sets the first output edge
- CM0 is crossed on the way down — this sets the second output edge
- SL=0 and SL=1 show the output polarity options — the pulse shape is the same, just inverted
- The result: both edges are equidistant from the counter peak — perfect symmetry

04 The Math
How are the compare values calculated?
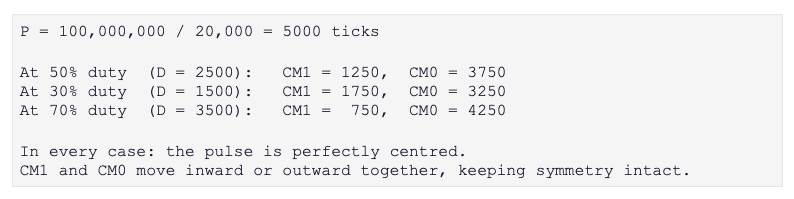
To place the pulse symmetrically, you need two comparison values — one for each edge.
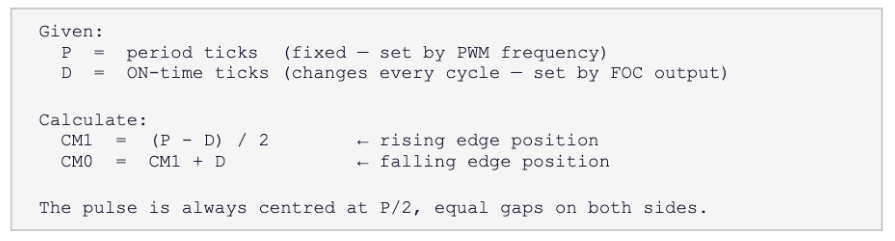
Real numbers at 20 kHz with a 100 MHz GTM clock:
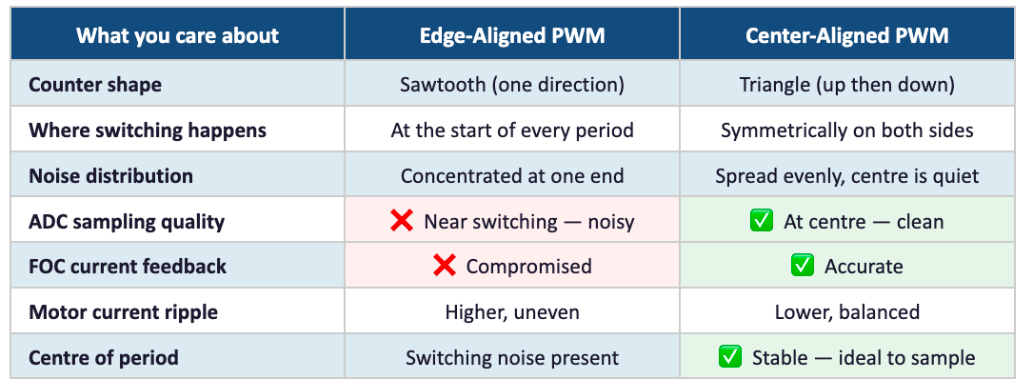
05 Comparison
Edge-Aligned vs Center-Aligned — the real differences
06 Why It Matters
Four reasons this is not optional for FOC
1 · Clean current measurement
FOC calculates what current to inject into the motor. If the current measurement is wrong, the math produces the wrong output — wrong voltages, wrong currents, wrong torque. Center-aligned PWM gives the ADC a clean, noise-free window to measure in every single cycle.
2 · Deterministic timing every cycle
The sampling instant is always at exactly T/2. Not roughly in the middle. Not after a software delay. Exactly T/2 — every cycle. This predictability is what makes the control loop stable, repeatable, and tunable.
3 · All three phases sampled together
A PMSM has three phases. FOC requires all three current measurements to be taken at the same electrical moment. Center-aligned PWM gives all three phases the same symmetrical timing, so they are always captured simultaneously.
4 · Control loop stops fighting noise
When ADC samples are clean, PI controllers have accurate data. They converge quickly and hold steady. When samples are noisy, the controllers constantly react to phantom disturbances — making the motor feel rough and unpredictable regardless of how well the gains are tuned.

07 Full System Flow
PWM, ADC, and FOC — the complete timing loop
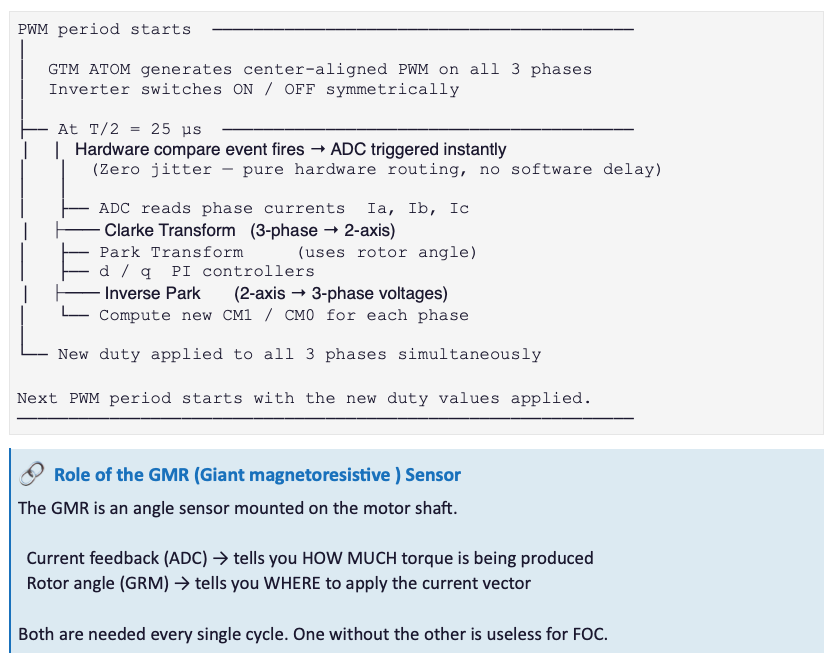
Here is what actually happens inside the controller every 50 µs:
08 Validation — Oscilloscope & Logic Analyser
Verifying the waveform on real hardware
We used two tools to validate the implementation: the Saleae Logic Analyser with PulseView for digital signal decoding, and the Tektronix TBS1072C oscilloscope for analog waveform verification.
Logic Analyser — PulseView (Saleae)
PulseView was used throughout the project — first to diagnose the edge-aligned problem (Fig 1), and then to confirm the fix after switching to center-aligned PWM. The capture below shows the corrected system: PWM_U_HS, PWM_V_LS, PWM_V_HS, and the ADC trigger all running correctly at 20 kHz.
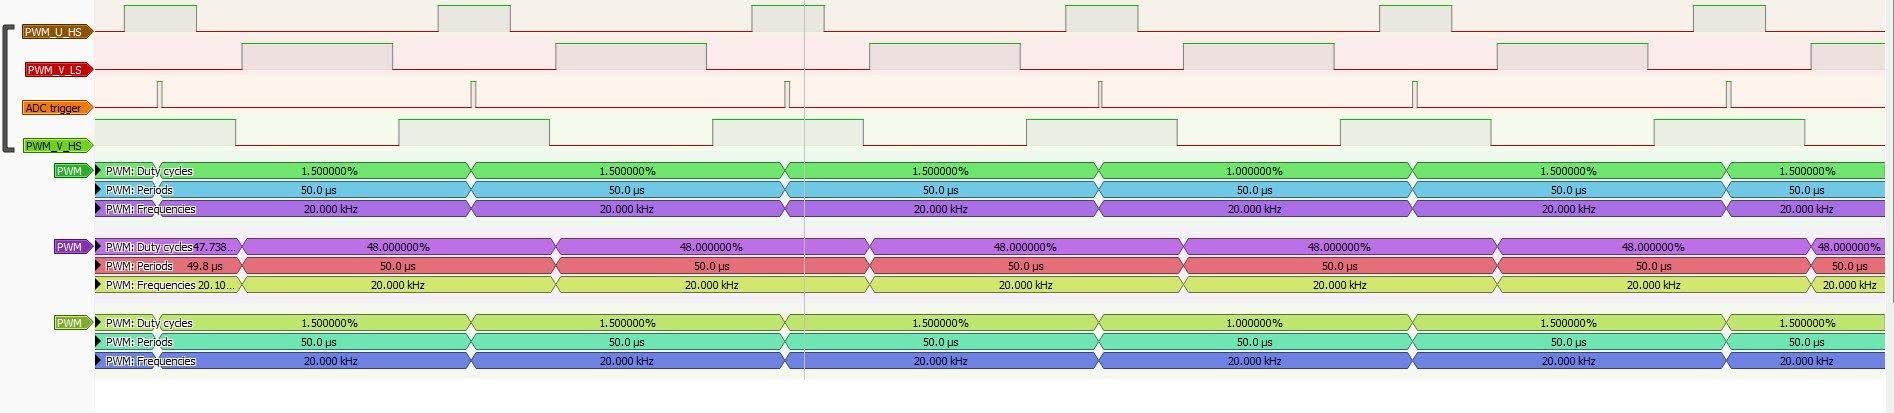
Fig 2 — PulseView capture after switching to center-aligned PWM. Signals: PWM_U_HS, PWM_V_LS, ADC trigger, PWM_V_HS at 20 kHz. The ADC trigger now fires as a narrow pulse at exactly T/2 = 25 µs into each period — at the quiet centre, away from all switching edges.
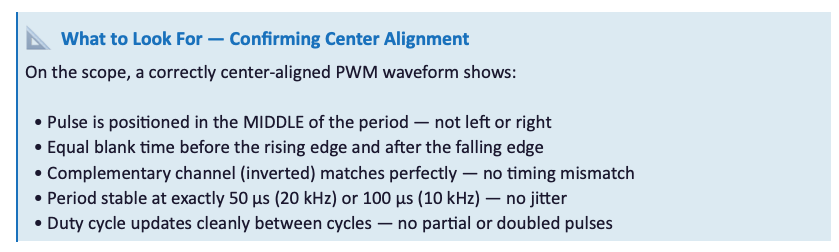
What to confirm in PulseView when validating center-aligned PWM:
- Period column should show exactly 50.0 µs on every row — no jitter
- Frequency should be 20.000 kHz consistently
- Duty cycle should match your calculated value and update cleanly each cycle
- No partial pulses, no missing edges, no doubled edges
Oscilloscope — Tektronix TBS1000C / TBS1072C
We captured the PWM waveforms at both 20 kHz and 10 kHz to confirm center-aligned behaviour across operating frequencies. Both captures were taken from the actual hardware.
20 kHz — Center-Aligned PWM on Two Complementary Channels
The first capture shows two complementary PWM channels (CH1 yellow, CH2 cyan) at 20 kHz. Both channels are visible simultaneously, confirming phase alignment and complementary switching behaviour.
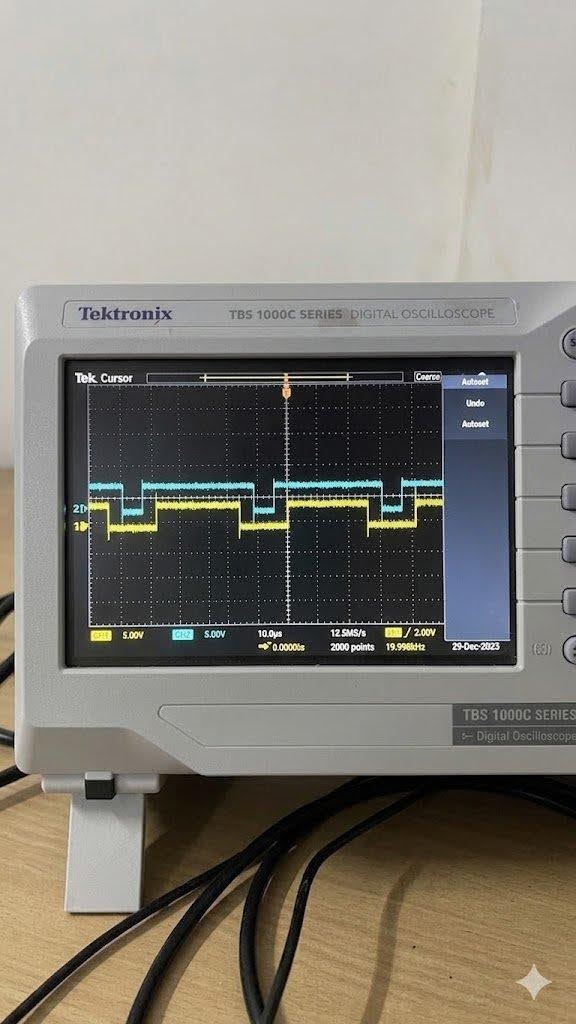
Fig 3 — Tektronix TBS1000C: Center-aligned PWM at 20 kHz (~19.998 kHz). CH1 (yellow) and CH2 (cyan) show complementary switching at 5V/div, 10 µs/div. Both channels confirm symmetric pulse placement.
10 kHz — Verifying at a Lower Frequency
The second capture shows the same center-aligned PWM architecture operating at 10 kHz. Dropping to 10 kHz doubles the period to 100 µs, giving more visible time to confirm pulse symmetry on screen.
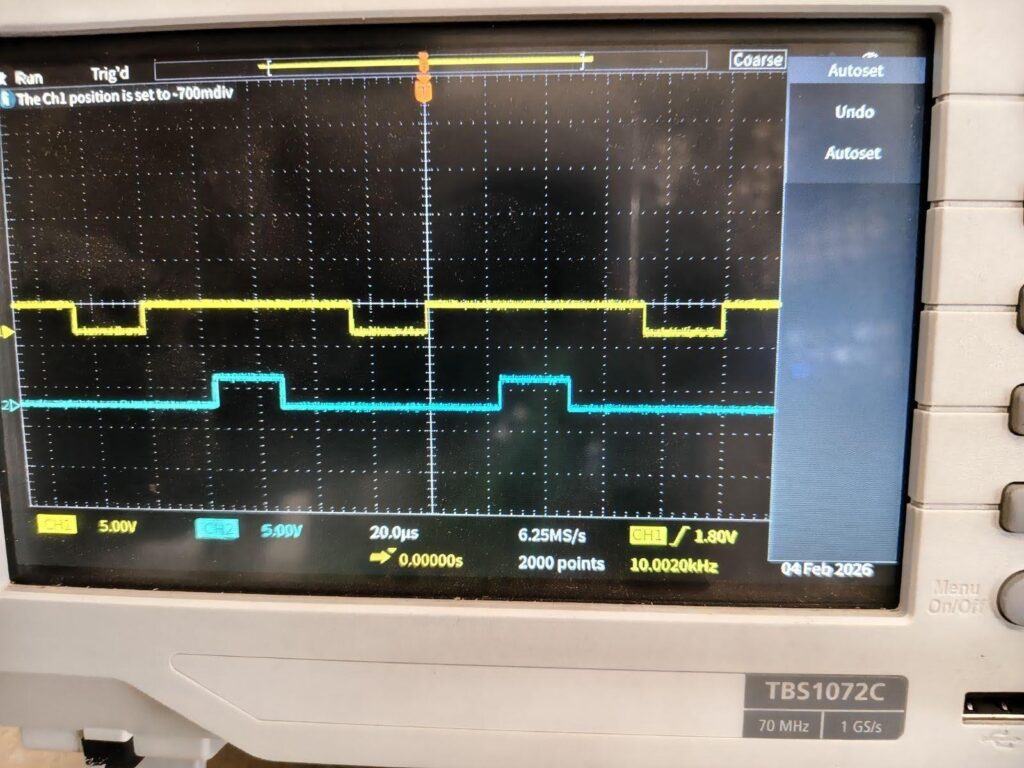
Fig 4 — Tektronix TBS1072C: Center-aligned PWM at 10 kHz (10.0020 kHz). CH1 (yellow) and CH2 (cyan) at 5V/div, 20 µs/div. The pulse is clearly centred within each period — equal guard time on both sides.
Dead-Time Measurement — Zoomed In
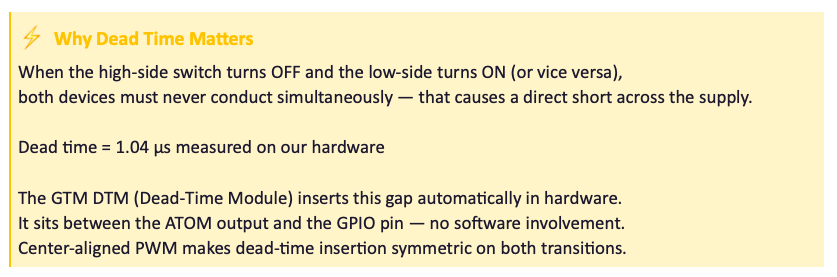
Dead time is the brief gap inserted between the high-side and low-side switching transitions to prevent both devices conducting at the same time (shoot-through). This zoomed capture measures the actual dead time on the hardware.
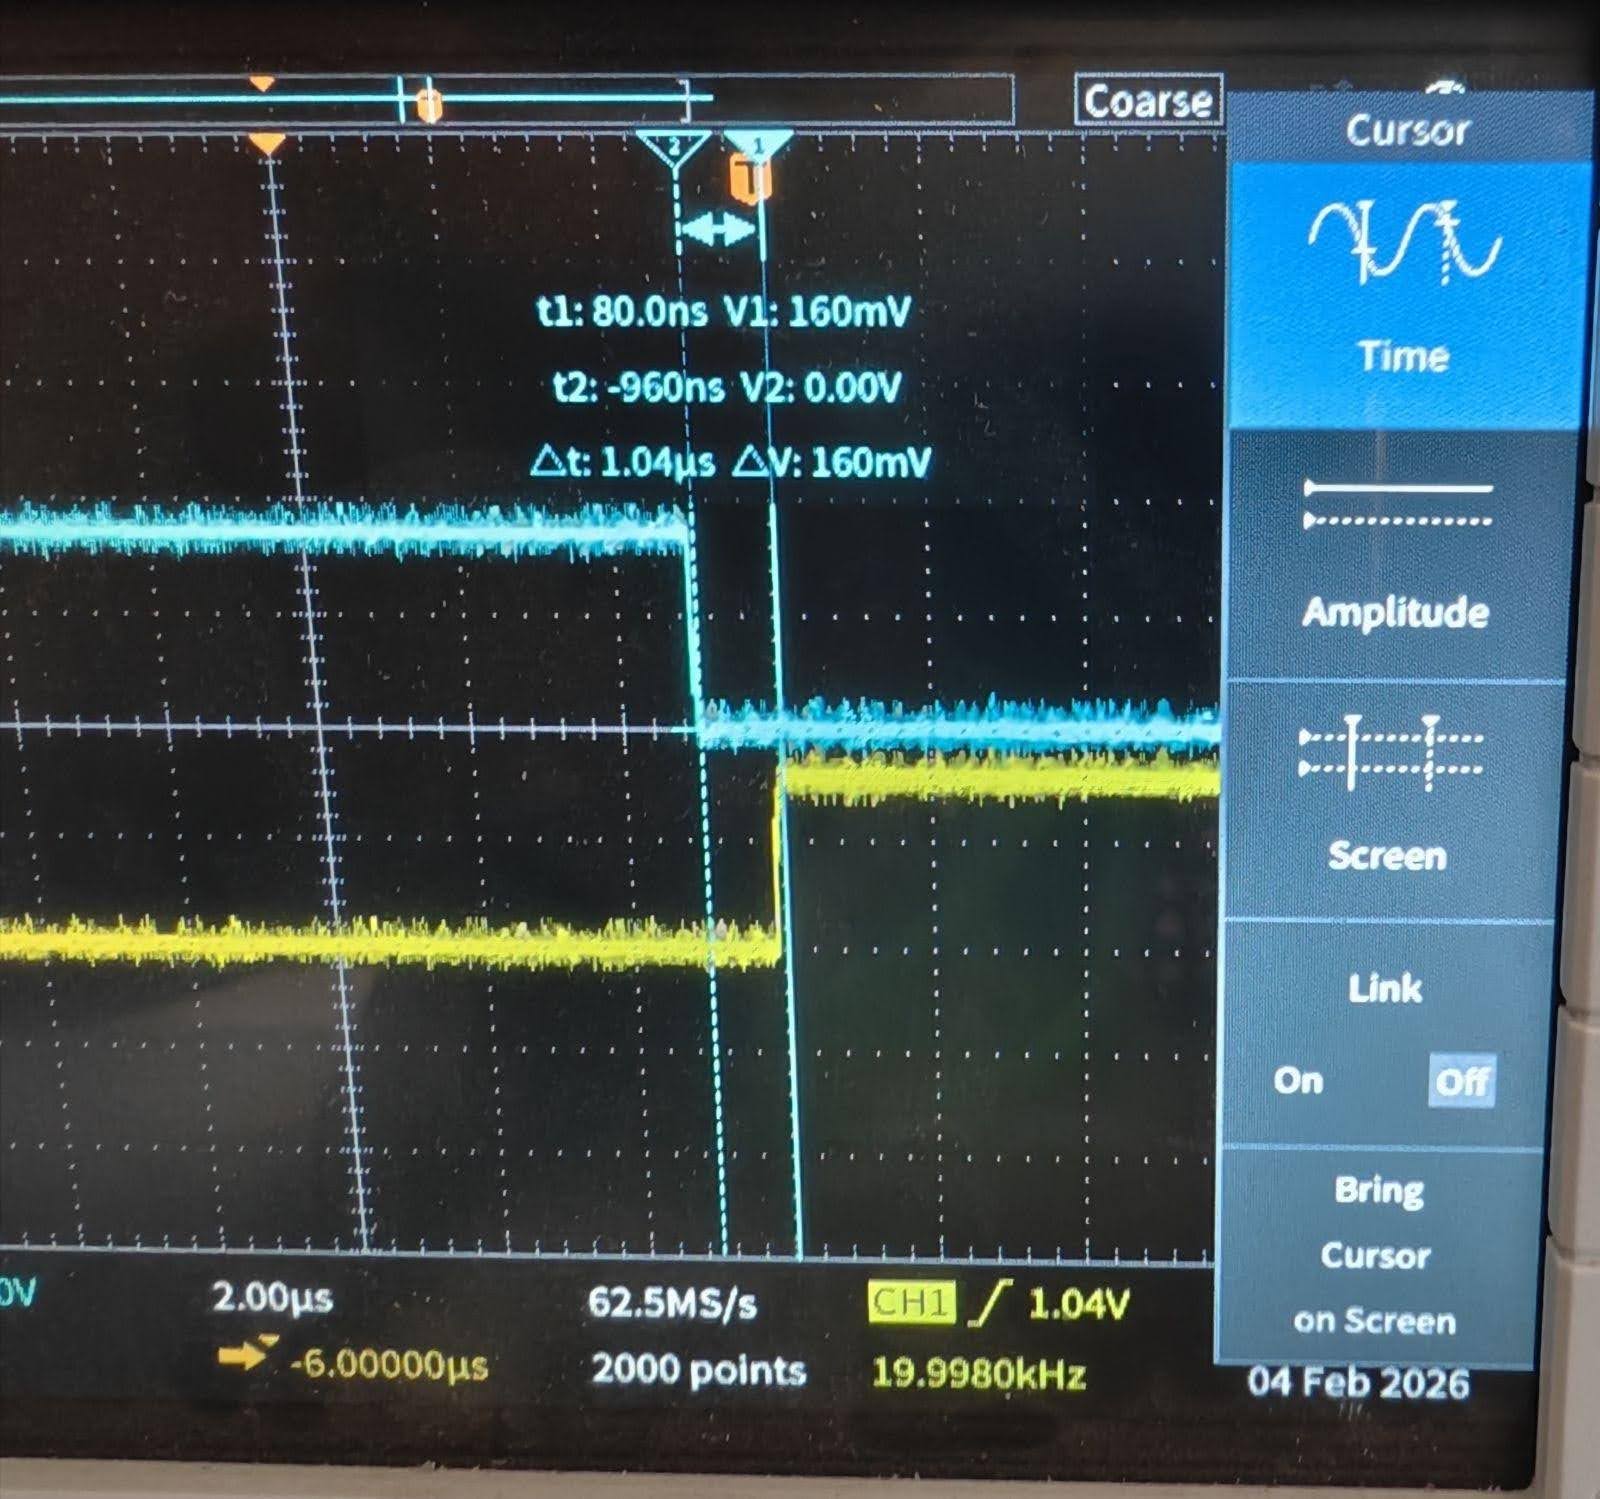
Fig 5 — Tektronix TBS1072C zoomed to the switching edge at 19.9980 kHz. Cursor measurement: Δt = 1.04 µs dead time, ΔV = 160 mV. The DTM (Dead-Time Module) in GTM inserts this gap to prevent shoot-through in the inverter half-bridge.
Tektronix TBS1072C — The Scope Used
All oscilloscope captures in this blog were taken using the Tektronix TBS1072C, a 70 MHz, 1 GS/s digital oscilloscope. It was the primary validation tool throughout the project for PWM waveform verification, dead-time measurement, and signal integrity checks.
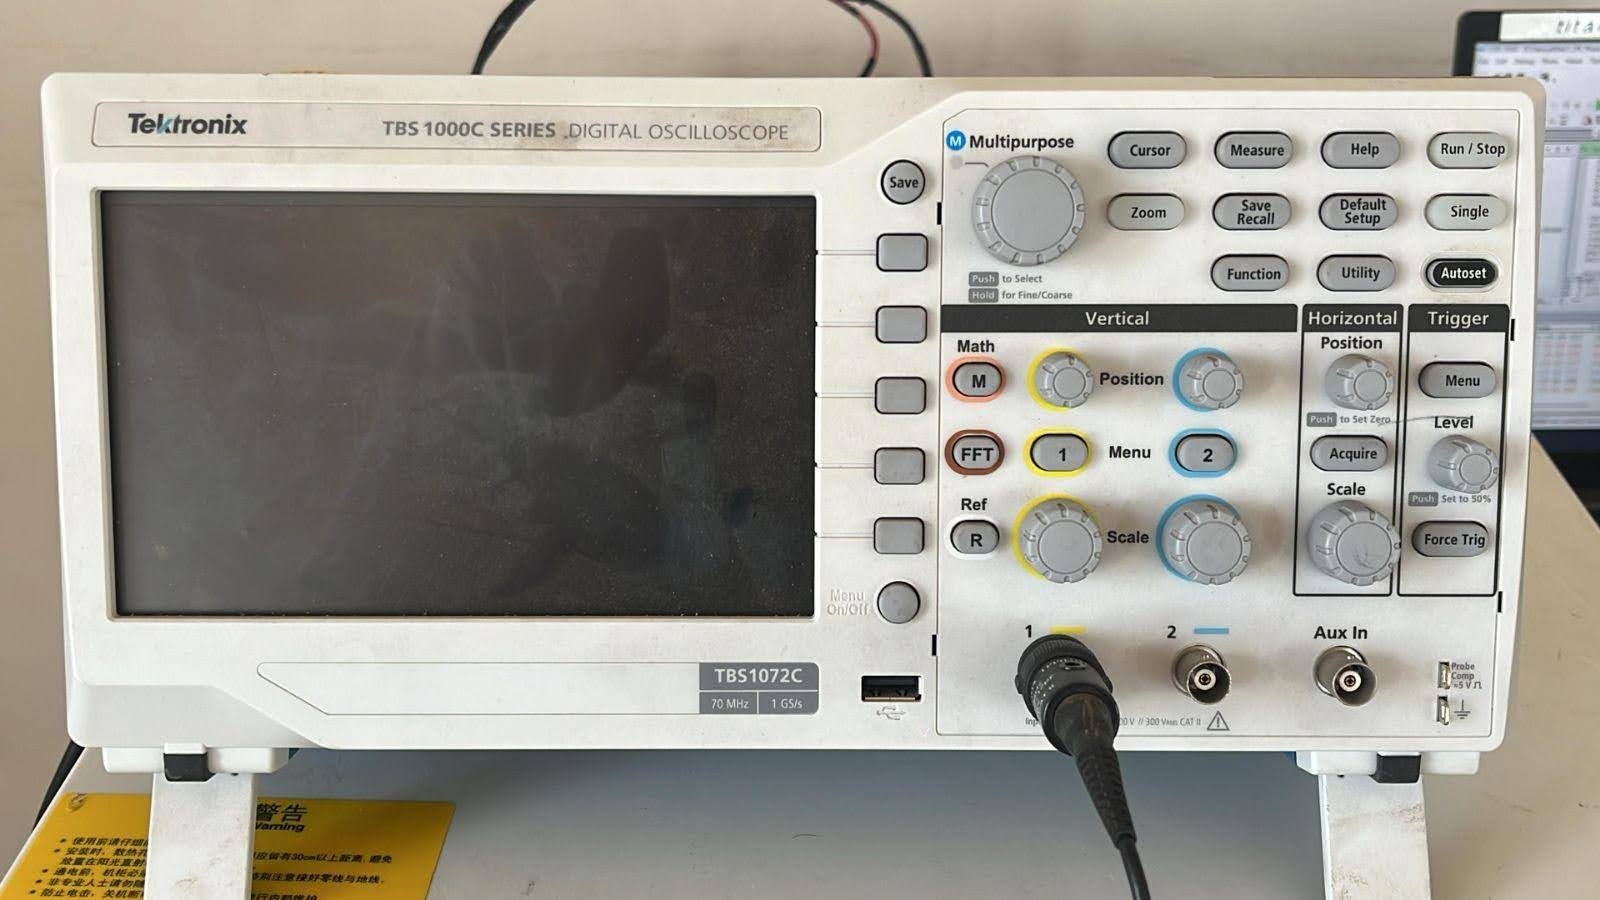
Fig 6 — Tektronix TBS1072C Digital Oscilloscope (70 MHz, 1 GS/s) used for all PWM and motor control signal validation on the project.
09 Results
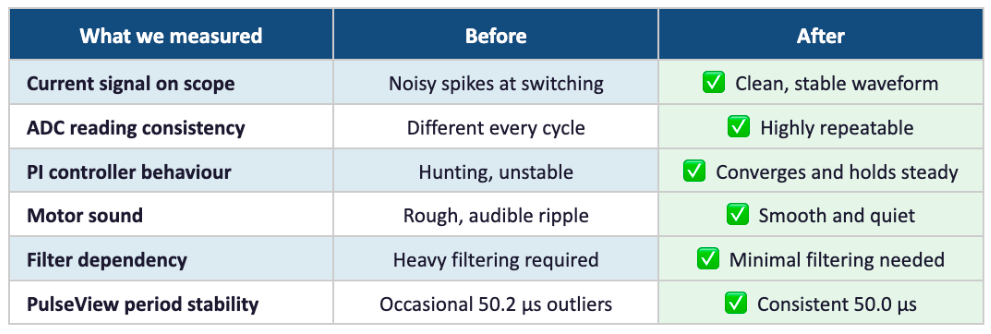
What changed when we switched to center-aligned PWM
10 Common Mistakes
Things we got wrong so you do not have to
- Triggering ADC from a software interrupt instead of a hardware compare event — adds jitter that looks like control instability
- Updating PWM phases one at a time instead of atomically — creates a brief window of phase imbalance every cycle
- Bypassing the hardware synchronisation mechanism causes asymmetric edges and phase imbalance
- Adding more filtering to hide noise when the sampling itself was wrong — treats the symptom, not the cause
- Trusting the waveform ‘looks centred’ without measuring — use cursors on the scope, human eyes miss 2–3% asymmetry
- Assuming the controller has a bug when, in reality, the timing was just off.
11 Key Takeaway
One thing worth remembering

If your FOC system feels unstable, do not immediately reach for more filtering or tighter PI gains. Check when your ADC is sampling relative to your PWM switching edges. That single change — moving the sample point to the quiet centre of the waveform.