Scenario-based testing checks an automated driving system against specific, described traffic situations, such as a car cutting in close ahead, instead of relying on miles driven. Each situation is written in a machine-readable format such as ASAM OpenSCENARIO, varied across many parameter values, and run in simulation before track and road tests. Regulators now expect this kind of evidence in a safety case, from UN R157 for Level 3 lane keeping to the new UN R185 for automated driving systems.
In 2016, researchers at RAND worked out that a self-driving car would need to cover about 275 million miles without a single fatal crash before its record alone could show, with 95% confidence, that it was at least as safe as an average human driver. For years that number was quoted as proof that nobody could drive their way to safety. This June, Waymo’s driverless fleet passed 271 million rider-only miles.
So were the sceptics wrong? Only partly. Those miles took one company several years and thousands of cars, in a handful of US cities, on one line of software. They say a lot about that system in those places. They say very little about a different vehicle, a new city or next month’s software release, and few others are in a position to repeat them. That is why the rest of the industry, and its regulators, lean on scenario-based testing. Instead of waiting for the road to throw up a rare, dangerous moment, engineers describe it precisely in a format a simulator can read, vary it thousands of ways, and run every variation long before a prototype is built.
We first wrote about this in 2023, when OpenSCENARIO 2.0 was new. A lot has moved since then. The standards have split and matured, and as of this year scenario-based evidence is written into global regulation. So this is a fresh introduction, from the basic vocabulary to how test campaigns are run and judged, along with the limits that usually get left off the slides. We also ran a small experiment for this post: four well-known driver models, the same cut-in, and noticeably different verdicts.
The miles argument, ten years on
The 275 million figure comes from a 2016 RAND report, Driving to Safety, by Nidhi Kalra and Susan Paddock. They asked a narrow statistical question: how many miles would a fleet need to log before its crash record alone proves something about safety?
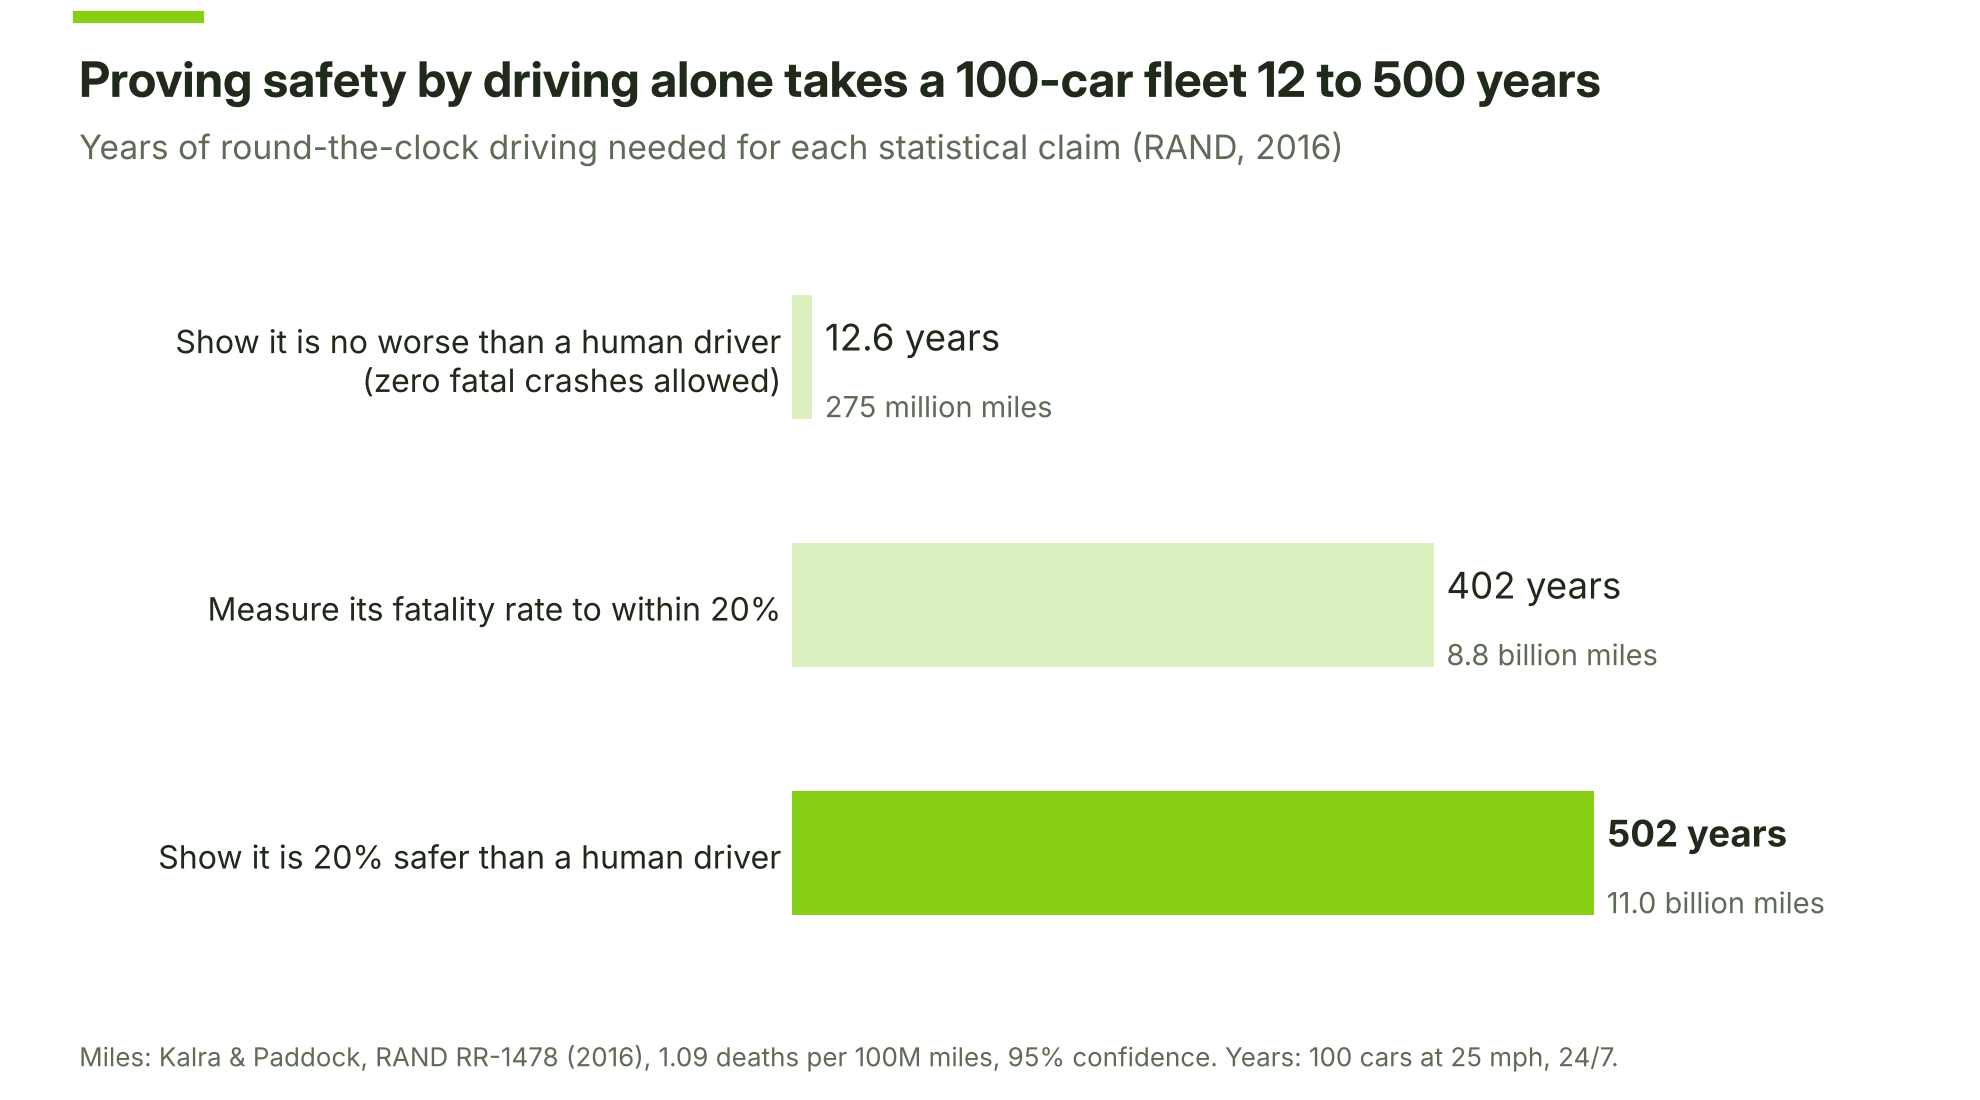
Figure 1. Miles a fleet would need to drive to prove safety from its record alone
The answer is large because fatal crashes are rare. RAND worked from 2013 US data, about 1.09 deaths per 100 million vehicle miles, and events that rare need enormous samples before the statistics settle. Their own conclusion was that developers “cannot simply drive their way to safety.”
In practice, it is worse than the chart suggests. Each software release is, strictly speaking, a different driver, so miles logged by the previous build don’t fully carry over. And almost all of those miles are dull: dry highway, light traffic, everyone behaving. The situations that actually break a driving stack, such as a child stepping out between parked cars or a truck drifting across the lane at dusk, might turn up a handful of times in a billion miles.
Waymo’s milestone shows that road miles can now pile up far faster than anyone expected in 2016, and the company reports far fewer injury crashes than human drivers over the same distance. But a mileage record is evidence about one system in one set of conditions. For a new vehicle programme, a new operating area or the next software build, the hard cases are still too rare to wait for. Road testing remains essential for showing what normal traffic looks like and for finding problems nobody modelled. It just can’t carry the safety argument on its own.
What a scenario actually is
So what do engineers write down, if they are not waiting for the road? Two terms first, since they often get mixed up. A scene is a snapshot of the road at one instant: who is where, what the lights show, what the weather is doing. A scenario is a sequence of scenes over time, with road users acting and events changing what happens next. The definitions most standards use today trace back to Ulbrich et al. (2015).
The vehicle carrying the system under test (SUT) is the ego vehicle. Everything around it is part of the scenario.
Every scenario also lives inside an operational design domain (ODD), the set of conditions the system was designed for. A highway lane-keeping feature might be specified for divided highways, dry or wet asphalt, daylight and speeds up to 130 km/h. ISO 34503 gives a common vocabulary for writing an ODD down. You can still test outside the ODD, but the question changes: does the system notice it has left its envelope, and does it hand back control, or reach a minimal risk condition, safely?
To organise what goes into a scenario, most teams use the six-layer model that grew out of the German PEGASUS project (Scholtes et al., 2021).
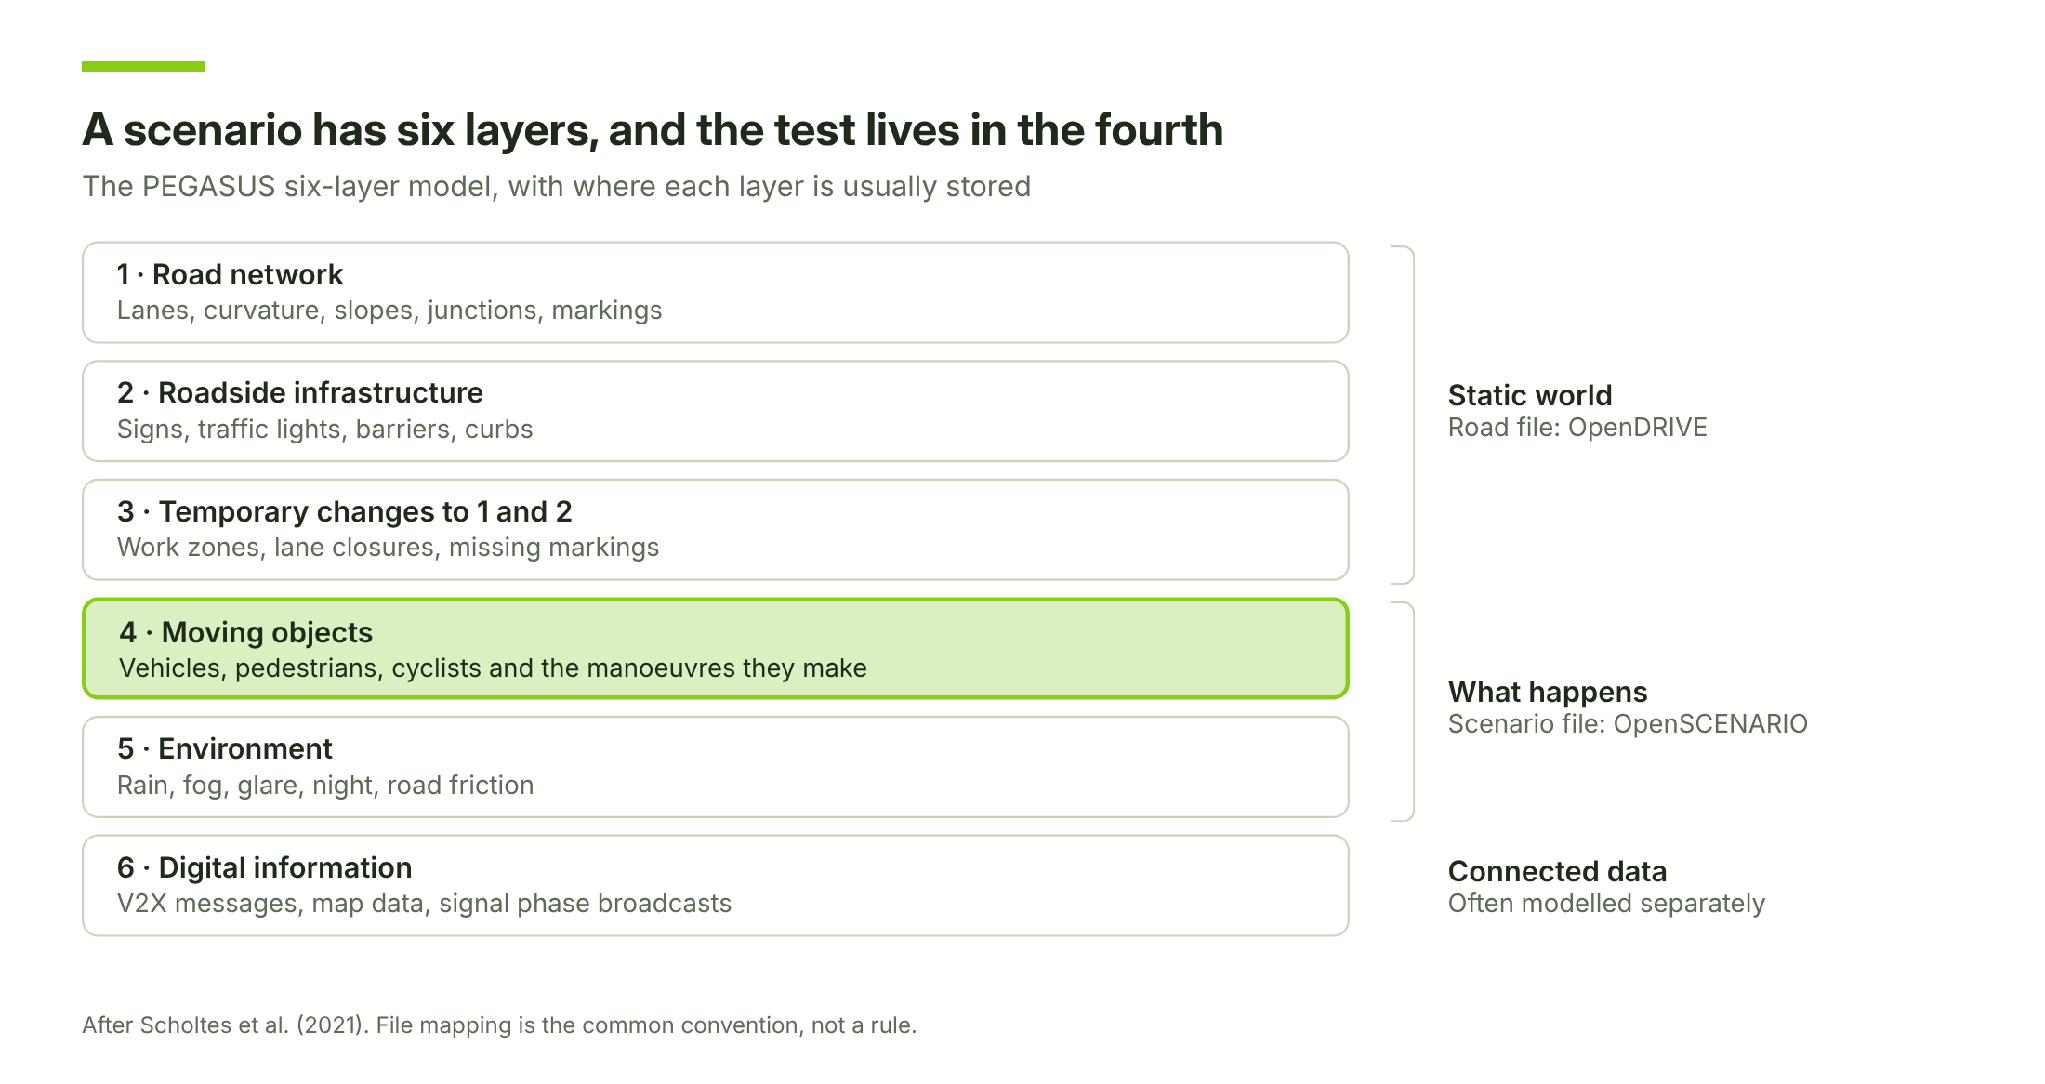
Figure 2. The six-layer model for describing a scenario
This split is why scenario tooling usually deals in two files. Layers 1 to 3 go into a road description that many scenarios share. The actors, their manoeuvres and the weather go into a separate scenario file that refers to that road. When a test campaign varies something, it is nearly always in layers 4 and 5.
Functional, logical and concrete scenarios
Take a situation every highway driver knows: a car from the next lane cutting in close in front of you. We will follow that cut-in through the rest of this post. The same situation can be written down at different levels of precision, depending on who needs to read it. The scheme in common use comes from Menzel et al. (2018), developed with input from the PEGASUS and aFAS projects. Here is a highway cut-in written all three ways.
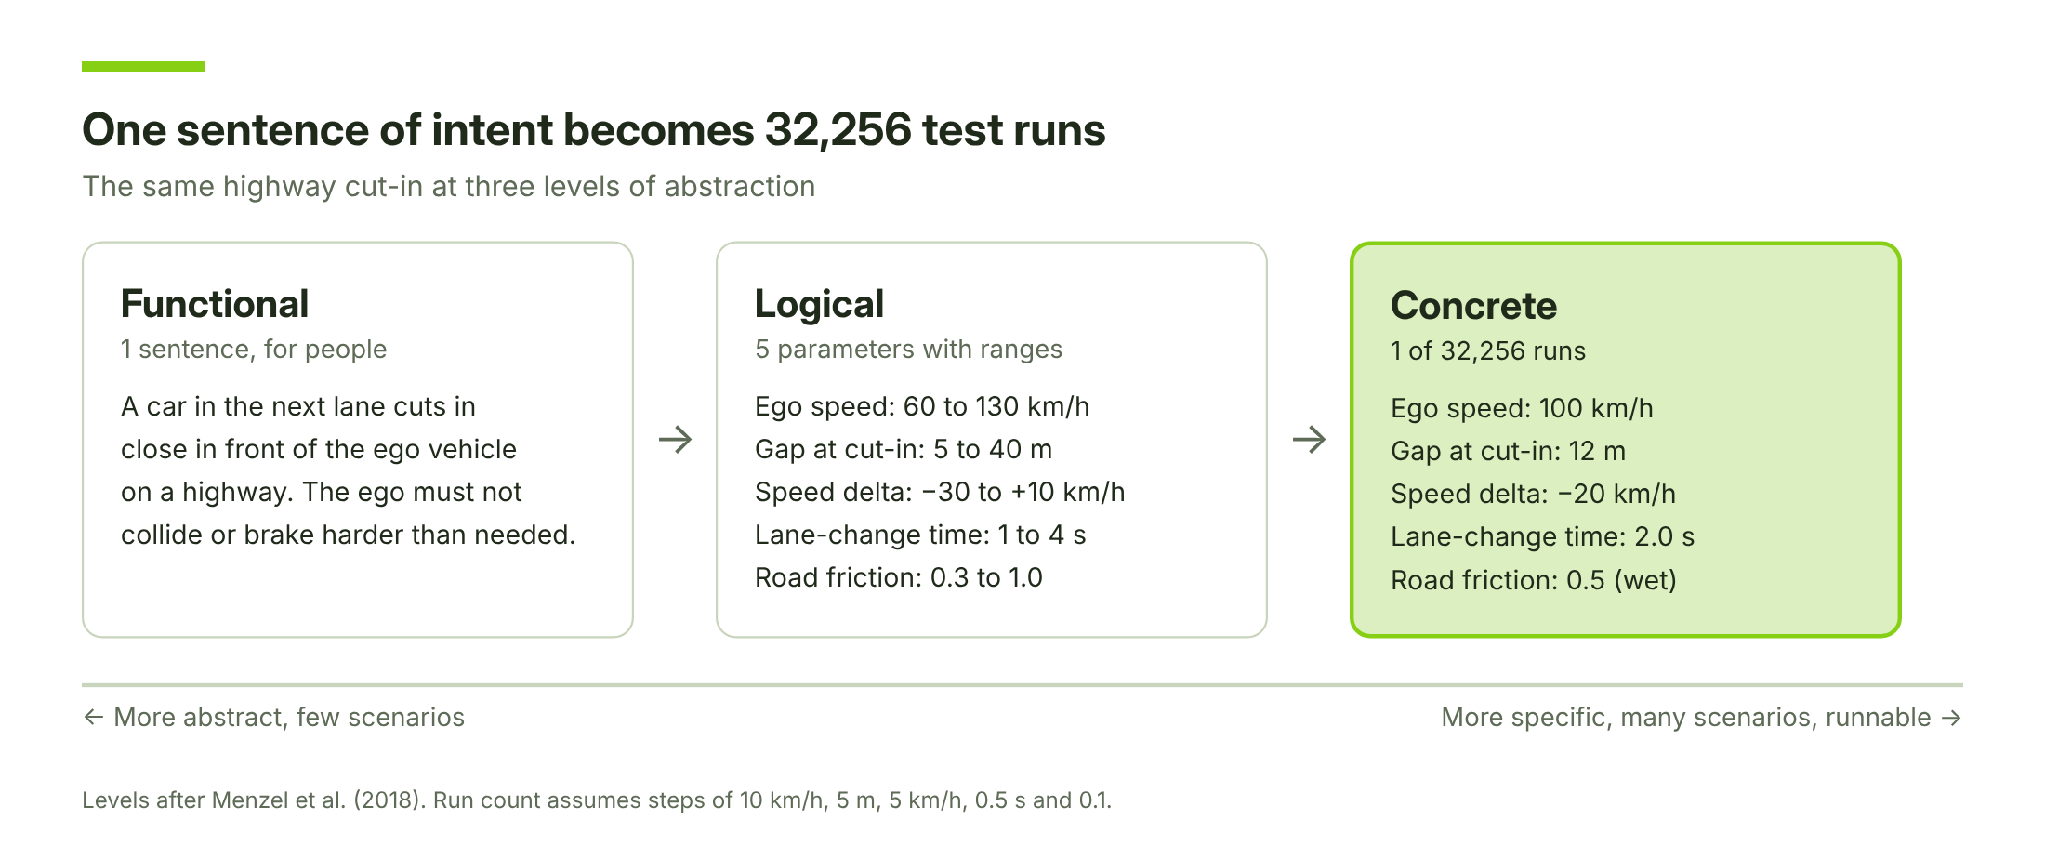
A functional scenario is plain language, the kind of thing a safety engineer writes during hazard analysis and a reviewer signs off on. A logical scenario replaces each detail with a parameter and a range. If you have traffic data, that range can carry a distribution, so common values get sampled more often than rare ones. A concrete scenario pins every parameter to a single value. Whatever tool you use, each simulator run is a concrete scenario, even when the tool chose the values for you.
The logical version above has five parameters. (Speed delta here is the cut-in car’s speed minus the ego’s, so a negative value means the cut-in car is slower.) Even at fairly coarse steps, that gives eight ego speeds, eight gaps, nine speed deltas, seven lane-change times and eight friction values: 8 × 8 × 9 × 7 × 8 = 32,256 concrete runs from a single sentence.
Neurohr and colleagues (2021) added a fourth level, the abstract scenario, which sits between functional and logical. It still describes intent rather than numbers, but in a formal language a machine can parse, such as the ASAM OpenSCENARIO DSL. Our 2023 post on concrete and abstract scenarios in OpenSCENARIO 2.0 works through this with code for a junction left-turn crash.
Keeping all these levels, instead of jumping straight to concrete files, gives you traceability. When a run fails, you want to be able to walk back to the logical range it was drawn from and the hazard it was meant to probe. Assessors will ask to see this chain, and rebuilding it after the fact is painful.
Why you can’t just run everything
Five parameters is a small logical scenario. A realistic cut-in would also vary the other car’s lateral speed, whether it brakes during the manoeuvre, a second car behind it, sensor noise, sun angle, and rain. Every parameter you add multiplies the run count by the number of values it can take.
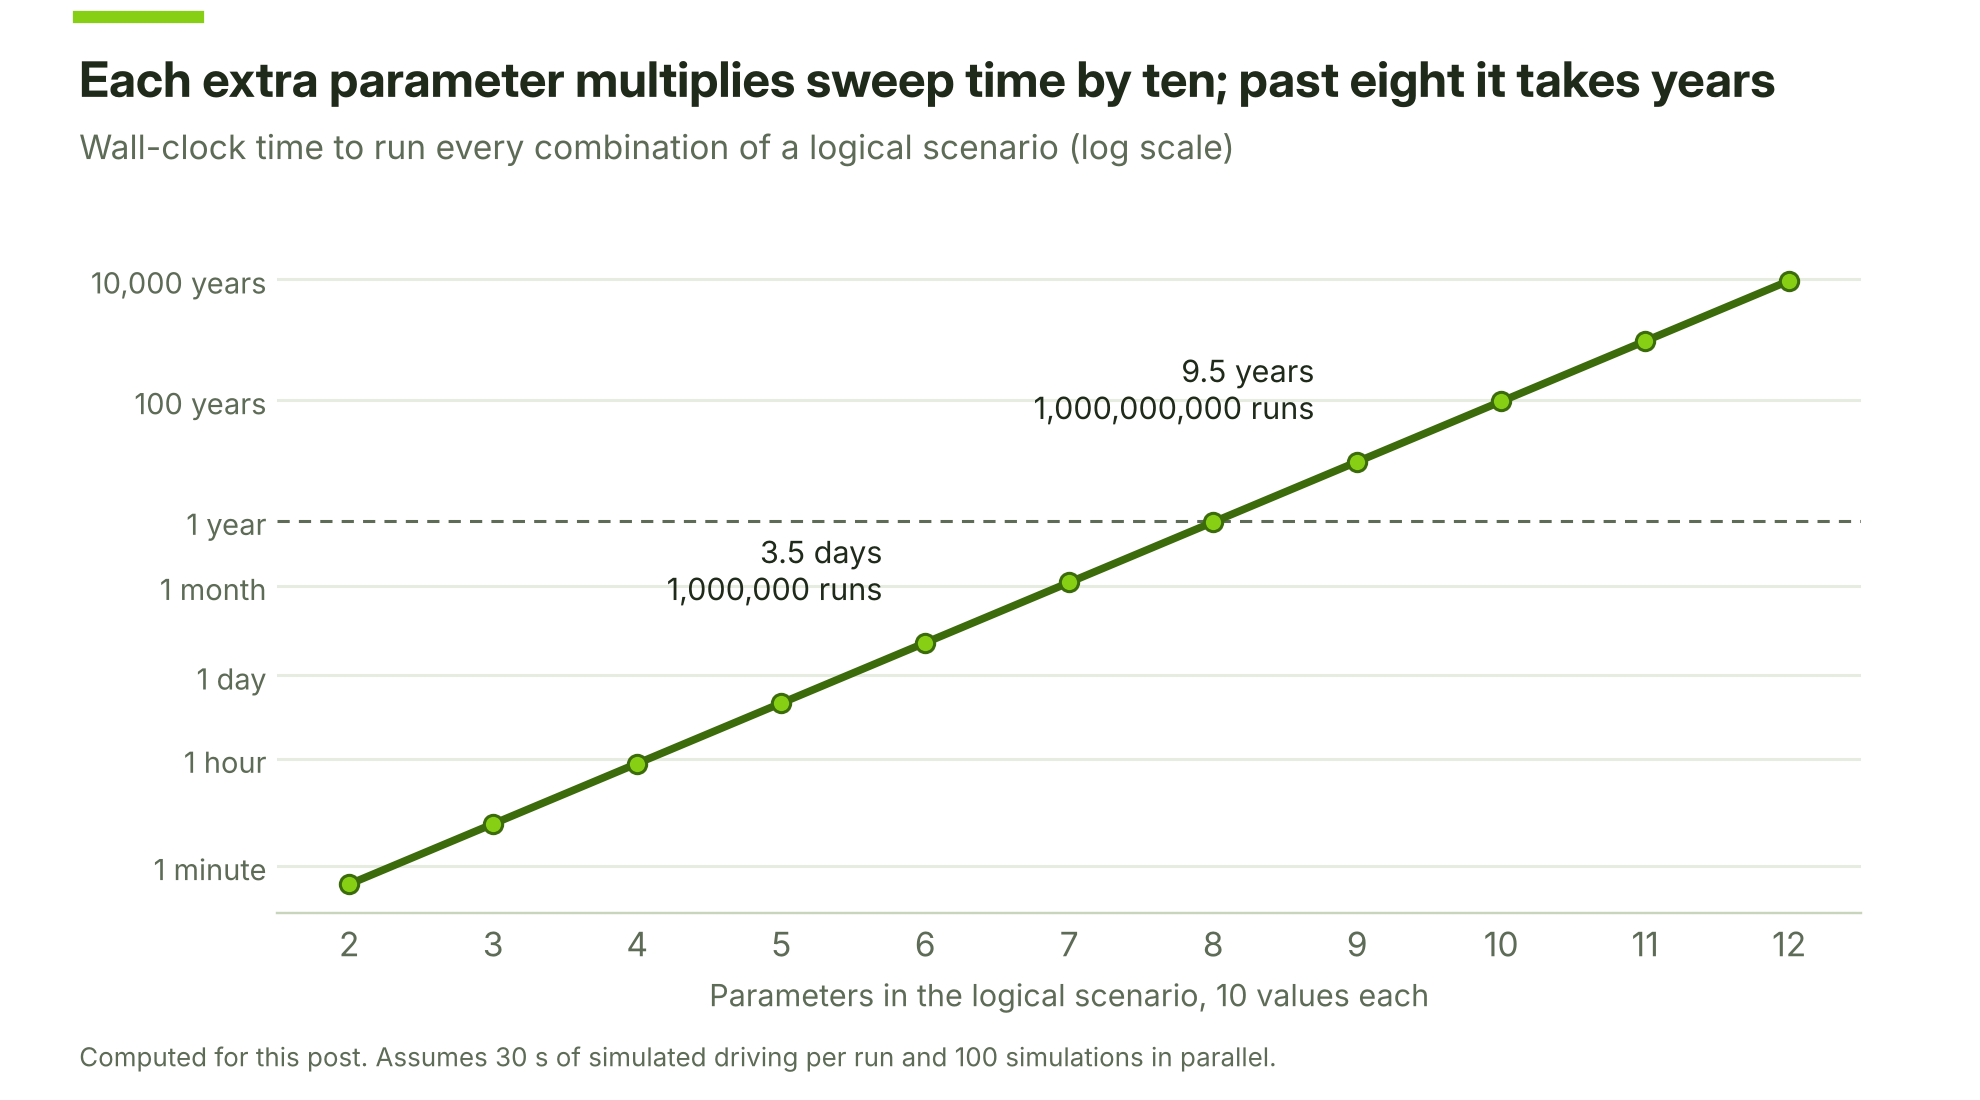
Figure 4. How each added parameter multiplies the run count
So exhaustive sweeps are ruled out, even in simulation, which was supposed to be the way around the miles problem. Grids are also wasteful in a less obvious way. In most of those combinations the ego car drives through without incident, and a run where nothing happens tells you very little.
In practice you do two things. You spend most of your runs on scenarios that are known to matter, and you search the parameter space for trouble instead of sweeping it evenly.
Where scenarios come from
Which cut-ins, then, and which other situations deserve those runs? No single source gives you a complete catalogue, and each one misses something different, so good catalogues mix them.
| Source | What it gives you | Where it is blind |
|---|---|---|
| Regulations and rating protocols (UN R157, UN R171, Euro NCAP) | Exact, repeatable test cases a system must pass for approval or a rating | A minimum bar, shaped by what can be staged on a test track |
| Crash databases (GIDAS in Germany, NHTSA’s CRSS in the US, RASSI in India) | The situations that actually injure and kill people | They record human-driver crashes; an automated system may fail in different places |
| Naturalistic driving data (fleet logs, drone datasets such as highD) | Real parameter distributions: how close people really cut in, how hard they really brake | Rare events stay rare in the data too |
| Expert analysis (hazard analysis under ISO 26262, triggering conditions under ISO 21448 SOTIF) | Situations that have not happened yet but could | Limited by what the team can imagine |
| Search and generation (optimisation, adversarial agents, scenarios rebuilt from video) | Combinations nobody thought to write down | Can produce situations that are physically or socially implausible |
Most of the current research effort sits in that last row. More and more teams rebuild scenarios straight from dashcam and fleet video: detect and track every road user, recover their trajectories, and write the result out as OpenSCENARIO on a matching OpenDRIVE road. Done well, a near-miss recorded on the road can become a regression test within days.
Catalogues also carry the traffic of wherever their data was recorded. Sets built from European or US data under-represent Indian conditions such as dense two-wheeler traffic, faded or missing lane markings, cattle on the road, and three-wheelers merging from odd angles. A system validated only on European or US traffic will not have seen most of this. We drive in it every day, so the gap is hard for us to ignore.
These sources also line up with the levels from earlier. Regulations give you concrete scenarios more or less ready to run, crash and naturalistic data give you logical scenarios with realistic ranges, and expert analysis mostly produces functional scenarios that someone then has to formalise.
Finding the runs that matter
To search a scenario space, every run has to produce a number, not just a pass or a fail. If the only output is “no crash”, a miss by 30 cm and a miss by 30 m look identical. The usual criticality metrics are:
- Time to collision (TTC): seconds until impact if nobody changes speed.
- Time headway (THW): the time gap to the vehicle ahead.
- Minimum distance: the closest approach during the run.
- Required deceleration: how hard the ego must brake to avoid impact, compared with what the road surface allows.
- Post-encroachment time (PET): for crossing paths, the time between one road user leaving the conflict zone and the other entering it.
Once each run has a continuous score, the score can steer the search. You run a spread of samples, look at which ones came closest to failing, and put the next samples near those. This is usually called search-based testing, or falsification, because the aim is to find a counterexample rather than to collect passes.
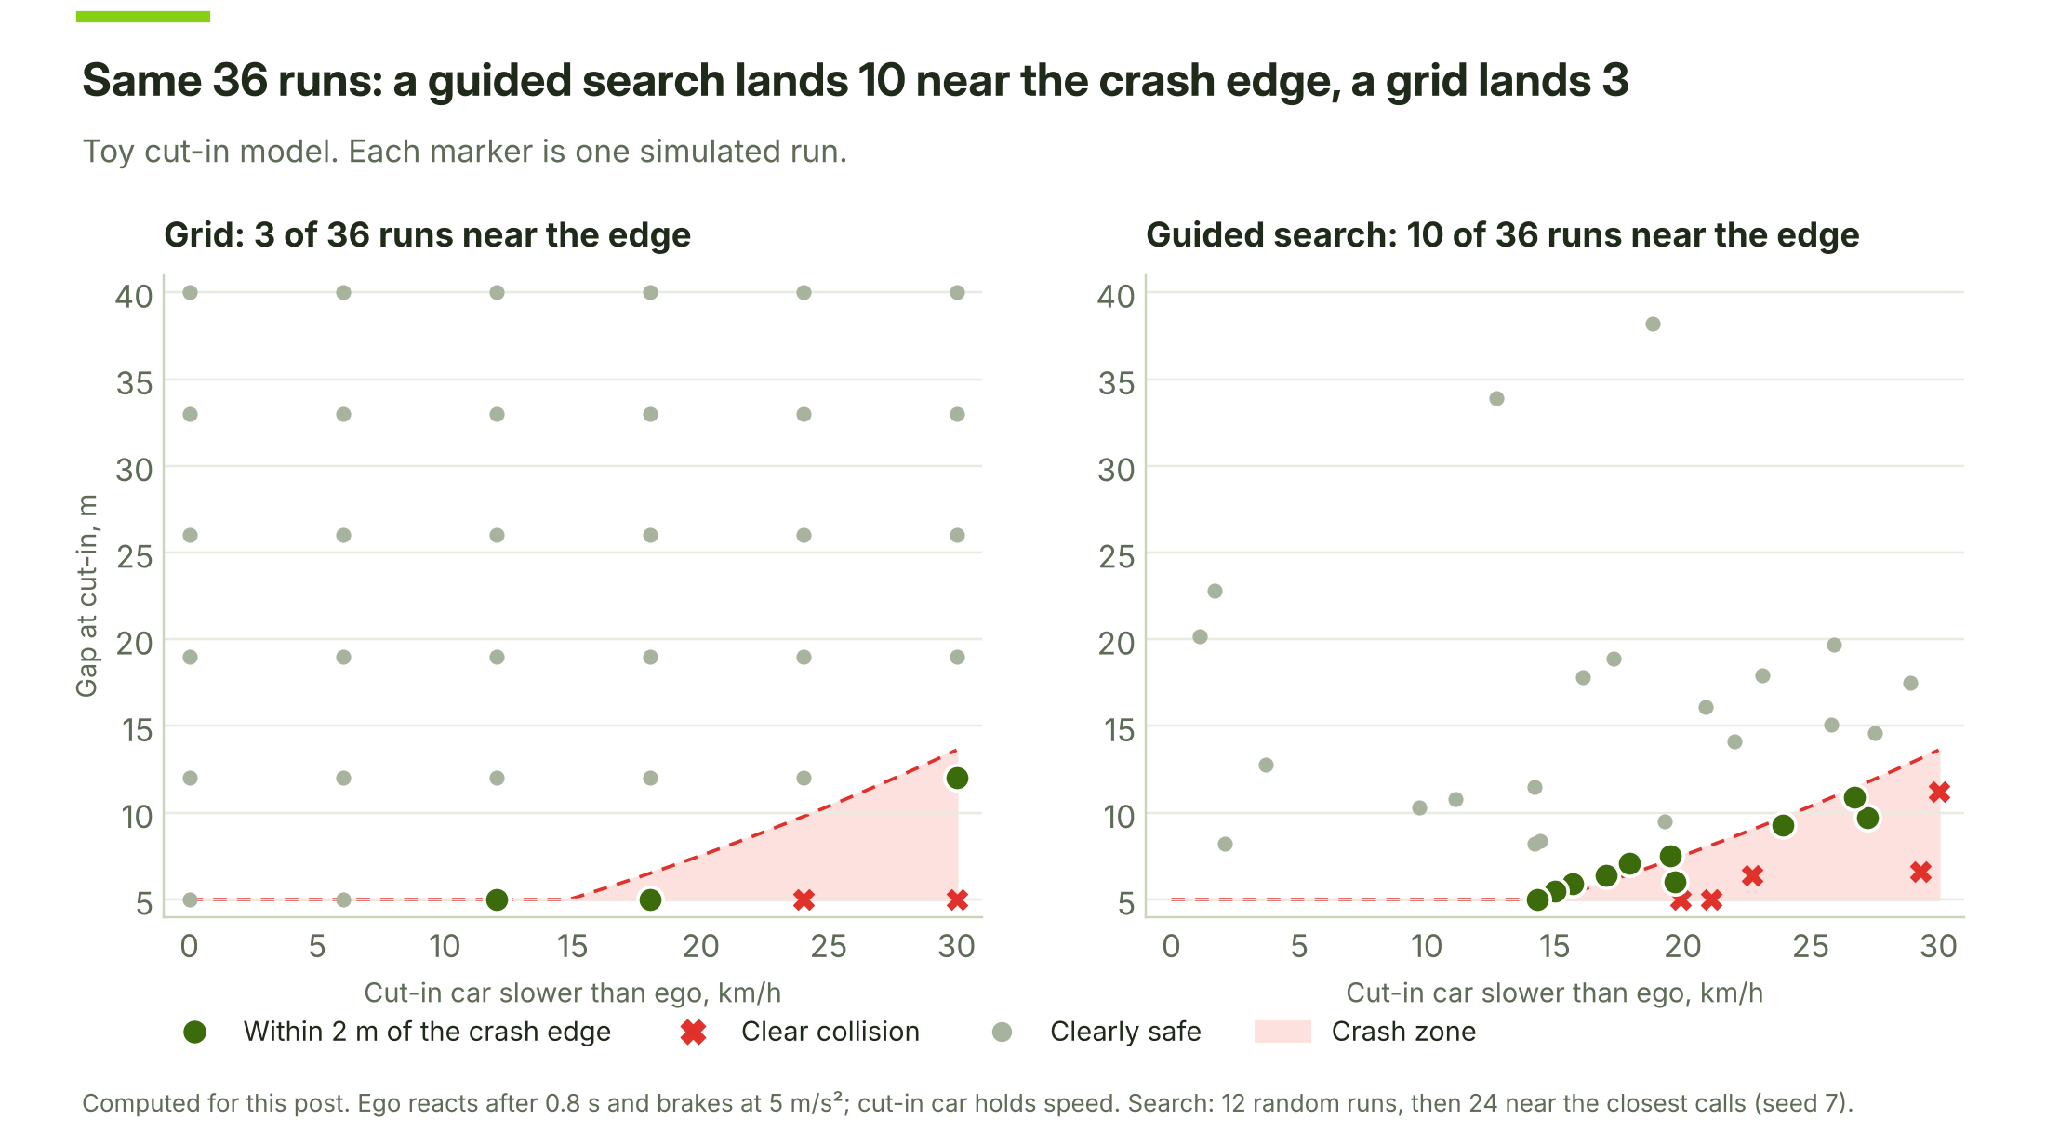
Figure 5. Grid sweep against guided search, same 36-run budget
The model behind this chart is deliberately crude, and both methods get the same budget of 36 runs. The grid puts most of its runs in the upper half, where the cut-in car is far away and nothing interesting happens. The guided search drifts towards the edge of the crash zone and, in this particular run, samples it more than three times as densely.
A real driving stack is less tidy than this toy. Its crash edge has dents and small islands caused by perception thresholds, tracker hand-offs and planner mode switches, and a coarse grid can step straight over them.
If you want to read further, these are the method names to look up: Latin hypercube sampling for spreading out the first batch of runs, Bayesian optimisation with surrogate models when each run is expensive, importance sampling when you need a failure rate rather than individual failures, and adversarial reinforcement learning, where an agent is trained to drive the other car badly on purpose.
OpenSCENARIO XML vs DSL, simulators and the test loop
Once you know which runs you want, they have to actually run. That means a scenario has to be in a format a simulator can read, and to move scenarios between tools the industry has settled on two open ASAM formats:
- ASAM OpenDRIVE (.xodr) describes the road: lanes, geometry, junctions, signals.
- ASAM OpenSCENARIO describes what happens on it. Since early 2024 it has been two separate standards rather than two versions of one, and the difference matters when you pick tools.
OpenSCENARIO XML (formerly 1.x) | OpenSCENARIO DSL (formerly 2.x) | |
|---|---|---|
Form | XML files checked against a schema | A text language, close to a programming language |
Style | Mostly imperative: storyboards, triggers, actions | Declarative: actors, behaviours and constraints |
Best at | Concrete scenarios, plus parameter sweeps | Abstract and logical scenarios, coverage goals |
Tool support in 2026 | Broad: esmini, CARLA ScenarioRunner (partial), most commercial simulators | Narrower; several compilers and research tools still maturing |
Recent releases | 1.3 (2024), 1.4 (May 2026) | 2.1 (2024), 2.2 (March 2026) |
ASAM is explicit that the two are not compatible and that it does not supply a converter. In practice, some teams describe intent in the DSL and execute concrete XML files, while others stay in XML throughout and keep the parameter logic in a separate file. Below is the same cut-in gap written both ways, trimmed for readability.
<!– cut_in_sweep.xosc (OpenSCENARIO root and FileHeader omitted).
Varies CutInGap, declared in cut_in.xosc, from 5 m to 40 m. –>
<ParameterValueDistribution>
<ScenarioFile filepath=”cut_in.xosc”/>
<Deterministic>
<DeterministicSingleParameterDistribution parameterName=”CutInGap”>
<DistributionRange stepWidth=”5.0″>
<Range lowerLimit=”5.0″ upperLimit=”40.0″/>
</DistributionRange>
</DeterministicSingleParameterDistribution>
</Deterministic>
</ParameterValueDistribution>
# OpenSCENARIO DSL: the gap is a constraint, not a list of values
scenario sut.highway_cut_in:
cut_in_car: vehicle
gap: length
keep(gap in [5m..40m])
do parallel(overlap: equal):
sut.vehicle.drive() with:
speed([60kph..130kph])
cut_in_car.drive() with:
lane(side_of: sut.vehicle, side: left, at: start)
lane(same_as: sut.vehicle, at: end)
position(distance: gap, ahead_of: sut.vehicle, at: end)
The XML file lists the exact values to run. The DSL states a constraint and leaves the choice of values to a solver or a search strategy, which is why it fits the logical level so well.
Execution means a simulator plays the scenario while the system under test drives the ego vehicle. esmini is a widely used open-source player for OpenSCENARIO XML, and the quickest way to check that a file does what you think it does. CARLA adds rendered camera, lidar and radar data. Commercial suites such as IPG CarMaker and dSPACE ASM bring detailed vehicle dynamics and hardware integration. A scenario then moves up through test setups that get slower and more faithful at each step: software-in-the-loop (SIL) on a workstation or in the cloud, hardware-in-the-loop (HIL) with the real ECU on a bench, and finally the proving ground. Most runs stay at the SIL level, and only the interesting ones are worth promoting.
Put together, the pieces form a loop, shown below.
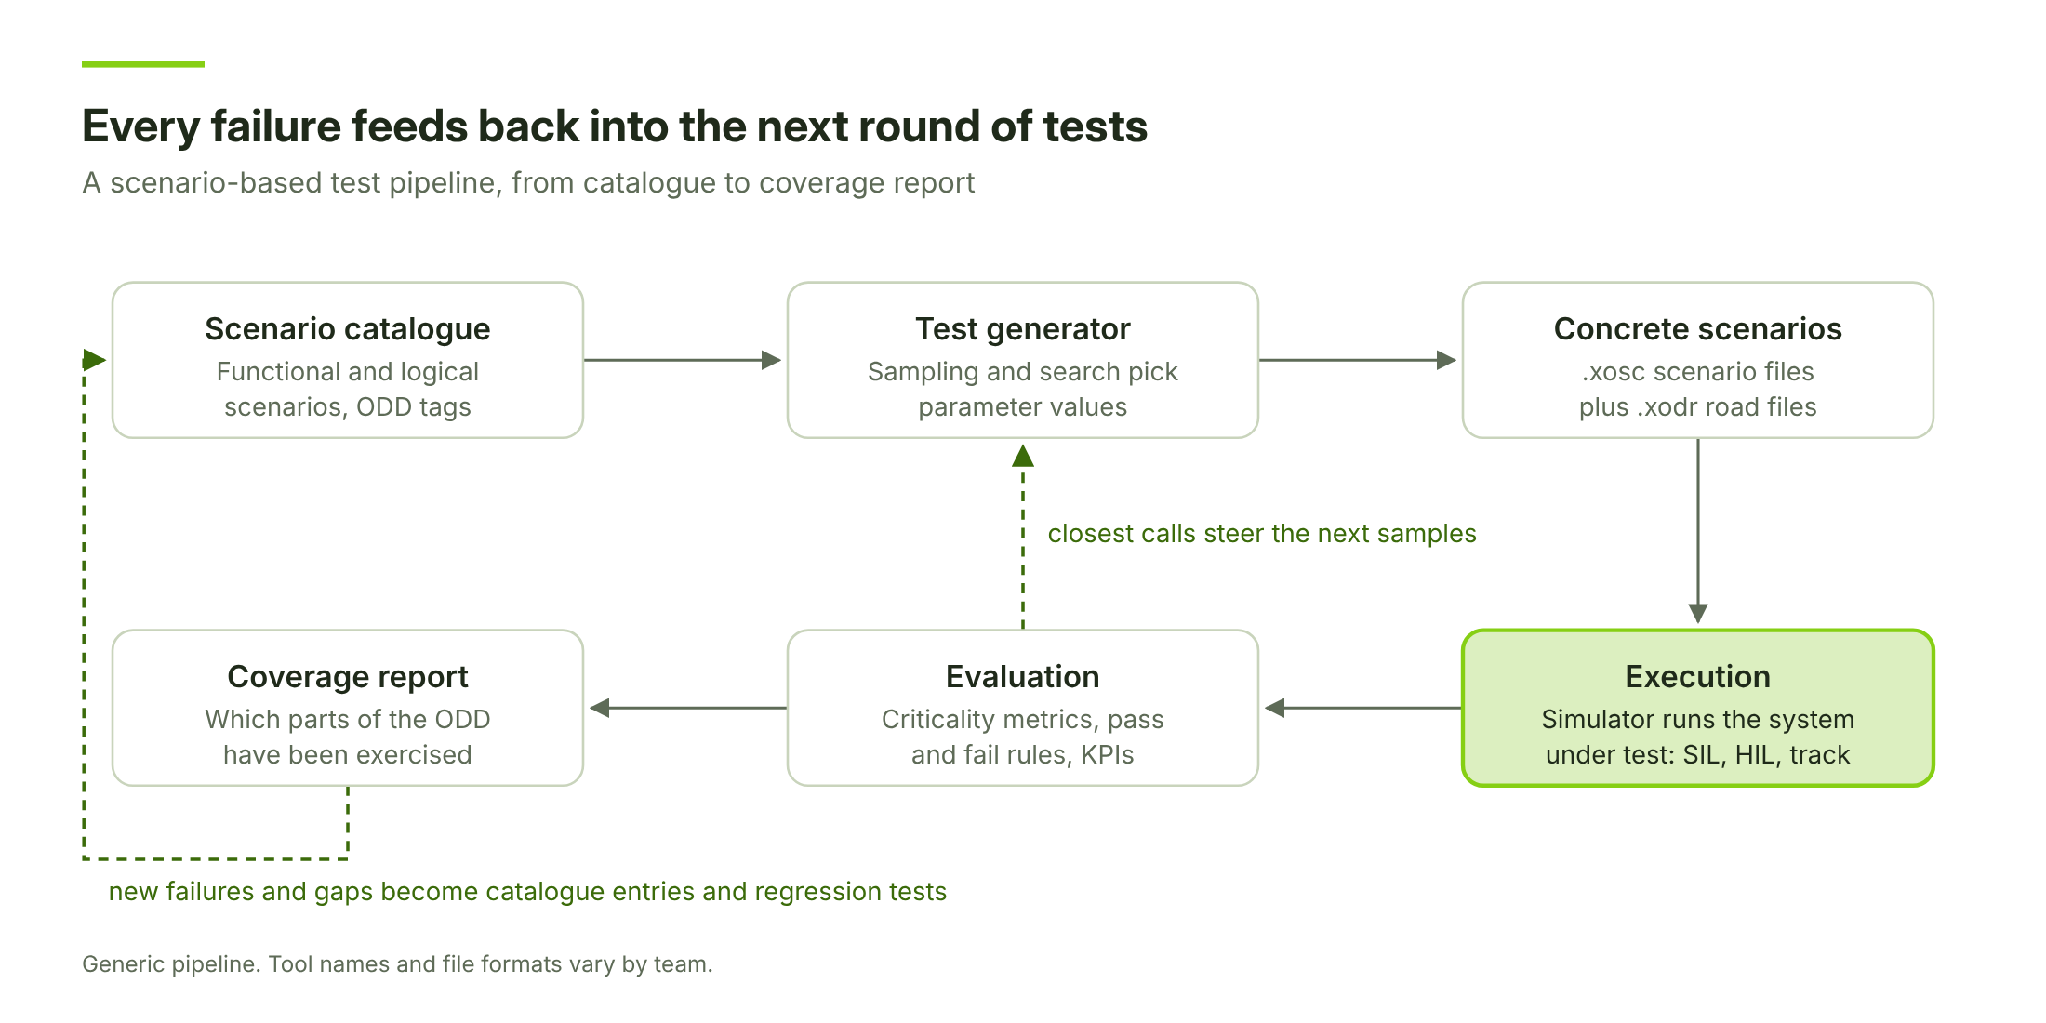
Figure 6. The scenario test loop
The dashed arrows are the important part. Within a campaign, search results feed back into the generator. Across campaigns, failures and coverage gaps go back into the catalogue, so a bug found once gets checked on every release after that.
Pass/fail criteria and reference driver models
Once you can run thousands of scenarios, you need a way to decide which ones the system passed, and test plans are often vague about this. Testers call this the oracle problem: for every run, something has to define what correct behaviour was. In practice, teams layer three kinds of rule.
- Hard rules: no collision, no unjustified lane departure, no running a red light. They are easy to check, and too blunt on their own.
- Thresholds: minimum TTC above a set value, peak deceleration below what passengers tolerate, a lane change finished within a time limit. Rating protocols such as Euro NCAP are largely built from rules like these.
- Reference models: some crashes can’t be avoided by anyone. If a truck swerves into you with 0.3 s of warning, hitting it is not a system failure, so the verdict compares the system against a model of what a good driver could have done. UN R157 uses a “competent and careful human driver” benchmark for this, and formal models such as Mobileye’s Responsibility-Sensitive Safety (RSS) do the same job with explicit equations for safe distances.
Comfort needs its own KPIs too: jerk, hard-braking counts, how often control is handed back to the driver. A system that never crashes but brakes hard at every cut-in will simply get switched off by its owner.
At campaign level, the useful numbers are failure rates per logical scenario, how close the system came to the crash edge across the parameter space, and how much of the ODD the campaign actually exercised. These numbers, traced back to the hazards they were meant to probe, go into the safety case.
Our experiment: one cut-in, four verdicts
The third kind of rule, the reference model, sounds like a detail. We wanted to see how much it actually matters, so we went back to our cut-in and ran the version that ships with esmini 3.1.0. The ego drives at 20 m/s under esmini’s ALKS R157 controller. A slower car in the next lane starts to cut in two seconds into the run and, two seconds after that, brakes at 5.2 m/s². We varied that car’s starting position (9 values) and speed (7 values) and ran all 63 combinations once with each of the controller’s four models: the R157 regulation model, the R157 reference driver, RSS, and FSM, the Fuzzy Safety Model developed at the EU Joint Research Centre.
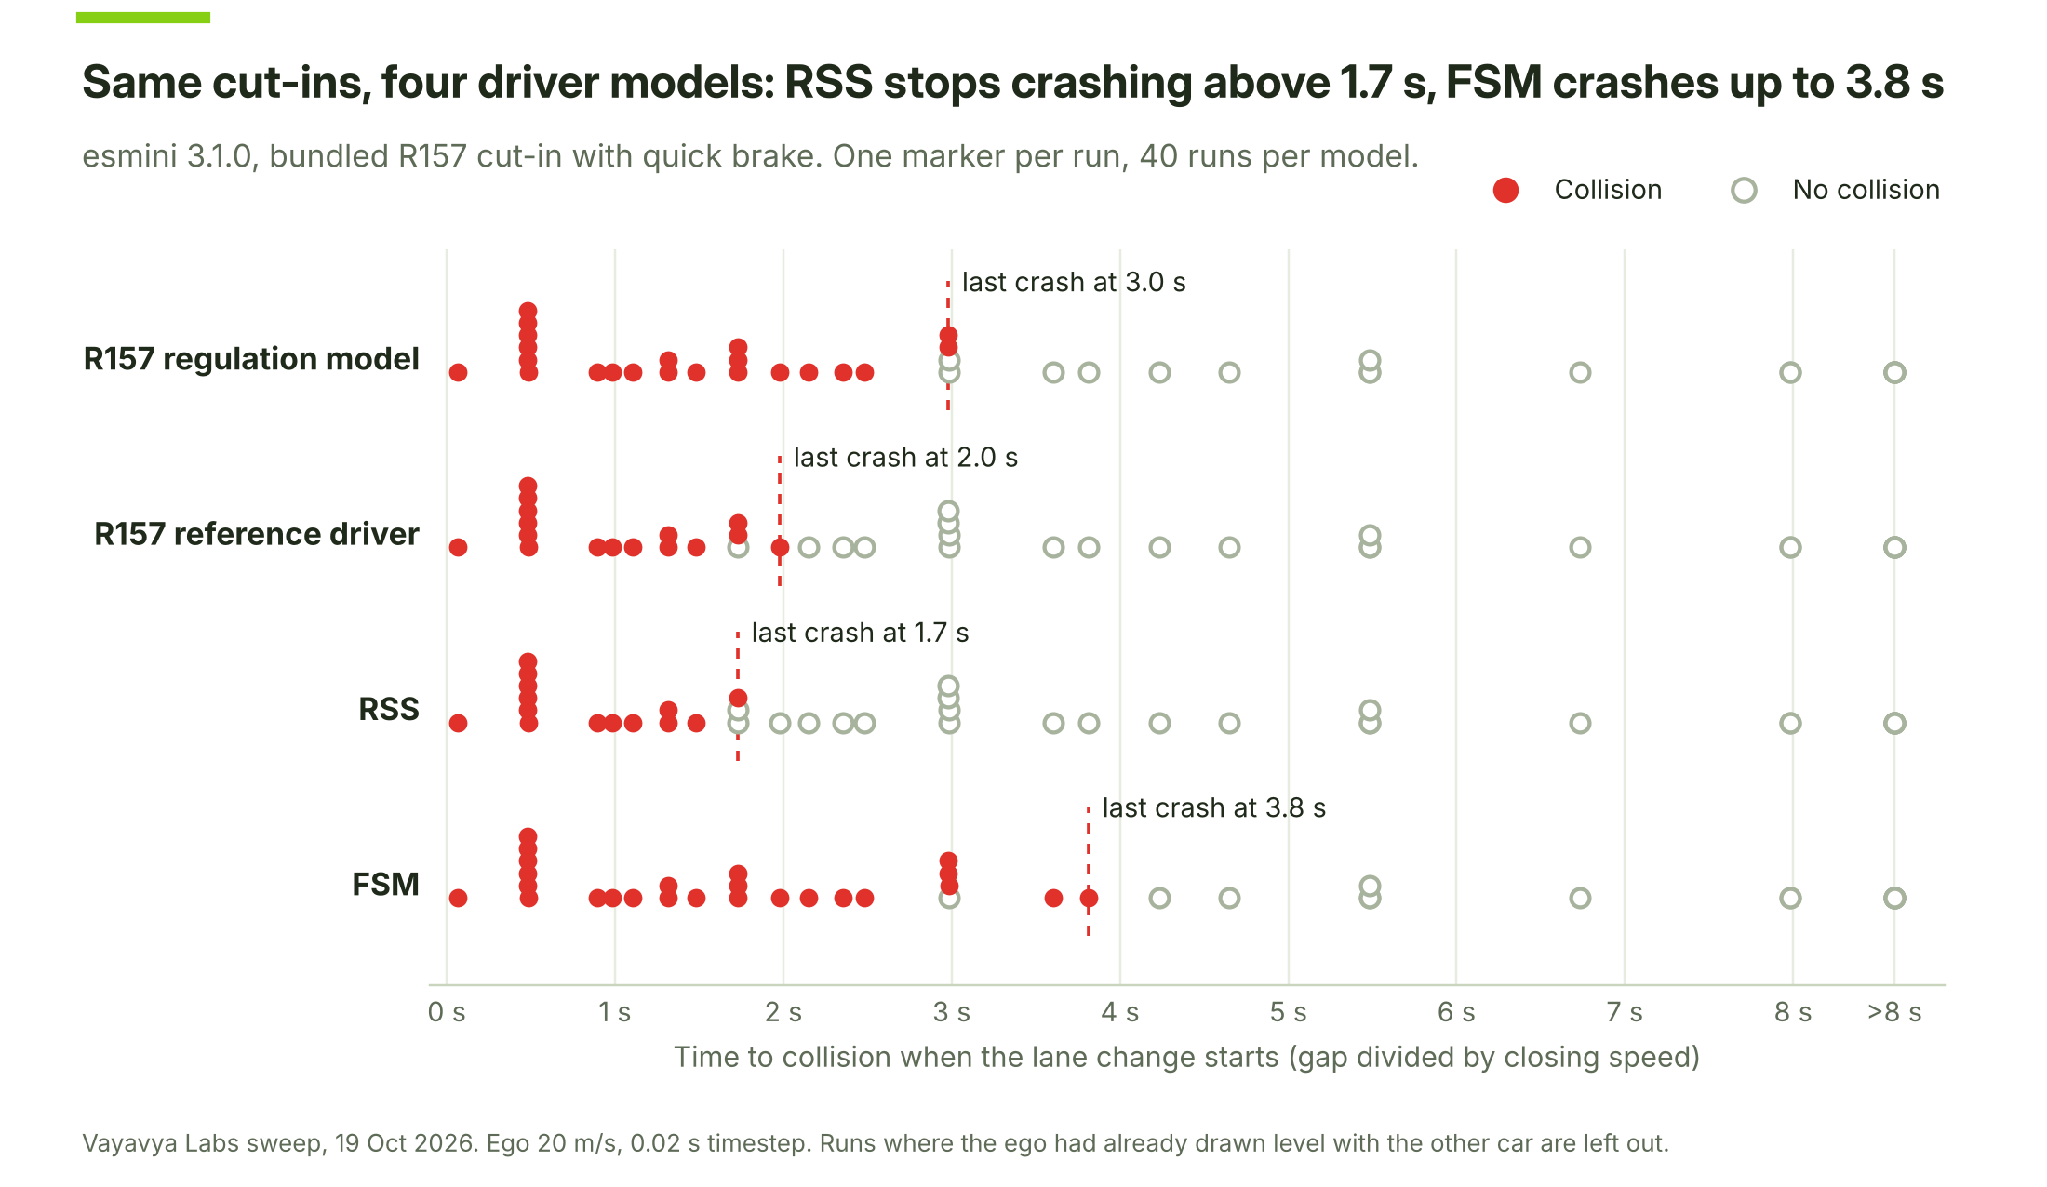
Figure 7. One cut-in, four reference driver models
Below about 1.5 s of time to collision, every model crashes; the other car is already on top of the ego when it moves over. Above that, the models part ways. RSS and the reference driver get through cut-ins that the regulation model and FSM do not, and FSM was still colliding at 3.8 s. FSM also produced a result that a crash count would hide. With no closing speed and a 40 m gap, it started braking 0.08 s after the lead car did, but at only about 4 m/s² against the lead car’s 5.2, and stopped 3.8 m short. Move the lead car 5 m further away and FSM waited about 2 s before braking at all, then ran into it at about 9 km/h, in a case every other model handled. That pattern looks like FSM’s fuzzy safe-distance thresholds at work rather than a simulator fault, and it is exactly the kind of cliff a coarse sweep can step over.
So the same scenario file gives four different pass rates depending on which model sits in the verdict, and the test plan has to say which one you are using and why.
The regulatory picture in October 2026
For most companies, the case for safety now has to satisfy a regulator as well as an engineer. Scenarios first appeared in regulation with UN R157 in 2021 and in the EU’s type-approval rules for automated driving in 2022. This year they became the global baseline. On 24 June 2026, WP.29 adopted the first global rules for automated driving systems, from Level 3 up to fully driverless: UN Regulation No. 185 and GTR No. 26 (UNECE, summary). Manufacturers have to support a safety case with simulation, closed-track testing and real-world validation across the ODD, and the virtual toolchains themselves have to meet credibility criteria. ISO/TS 5083 and UL 4600 are the usual references for how to structure that safety case.
Framework | Covers | What it asks of scenario testing | Status, Oct 2026 |
|---|---|---|---|
UN R185 and GTR 26 | Automated driving systems, Level 3 to driverless | Safety case built on simulation, track and road testing across the ODD; credible virtual toolchains; in-service monitoring and incident reporting | Adopted June 2026; R185 applies through type approval, GTR 26 must be transposed nationally |
UNECE NATM, the multi-pillar method (explained in Op den Camp and de Gelder, 2025) | How ADS are assessed | Scenarios are the shared input to every pillar: virtual testing, track, real-world, audit, in-service monitoring | The method behind R185 and GTR 26 |
UN R157 (ALKS) | Level 3 lane keeping on motorways | Specified cut-in, cut-out and deceleration scenarios, judged against a competent and careful driver benchmark | In force since 2021, amended since |
UN R171 (DCAS) | Level 2 hands-on and hands-off assistance | Test scenarios in its annexes; system limits tied to them | 02 series adopted by WP.29 in June 2026 |
Scenario-based safety evaluation of ADS on limited-access highways | A process for deriving test scenarios that cover the relevant scenario space | Published | |
ISO 21448:2022 (SOTIF) | Hazards from performance limits, not faults | Find and shrink the set of unknown unsafe scenarios | Published; revision under way |
Consumer ratings in Europe | Larger, more varied ADAS test matrices; one test-equipment maker counts more than 1,200 scenarios | In force from January 2026 |
In short, regulators no longer accept a list of passed tests on its own. They want to see why your scenarios cover the ODD, why your simulation can be trusted where you relied on it, and how you will keep watching once vehicles are in service.
What it can’t tell you
Scenario-based testing has real limits, and they are easy to lose sight of once a pipeline starts producing green dashboards.
Coverage is not the same as safety. You can exercise every logical scenario in your catalogue and still miss a situation that was never written down, because coverage only measures how thoroughly you tested your own list. Real-world driving and in-service monitoring are there to catch what the list misses.
Then there are the models inside the simulator. Vehicle dynamics models are mature; sensor models much less so. A stack that passes when fed perfect object lists can fail on rendered camera frames with glare, or on lidar returns from a wet road. This gap is why regulators now ask for evidence that the toolchain is credible.
Scripted traffic doesn’t react. In many scenario files the other car follows a fixed path whatever the ego does, while real drivers brake, honk and swerve back. Interactive agents help, though they bring modelling assumptions of their own.
A failure rate means little without an exposure rate. Failing 2% of runs in a cut-in scenario only becomes a risk estimate once you know how often such cut-ins happen on real roads, and that exposure data is scarce for many regions.
The last problem is that a system can end up tuned to the test itself. A catalogue that never changes invites tuning to it, which is one reason rating protocols keep growing and randomising their test matrices. We think internal catalogues need the same treatment.
If you’re starting out
For a team setting this up for the first time, this order avoids the most common expensive mistakes.
- Write the ODD down before anything else: road types, speeds, weather, lighting, regions. Every later decision depends on it.
- Pick a small set of functional scenarios from your hazard analysis and the regulations you have to meet. Keep the set small and define each one properly; fifty vague scenarios are hard to turn into anything testable.
- Turn them into logical scenarios, taking ranges from data where you have it and noting where you guessed.
- Start with open tools. Validate files against the ASAM schema, then play them in esmini, before an expensive simulator ever sees them.
- Add a criticality score and a simple search before adding more scenarios. A guided search over ten scenarios often finds more failures than a grid over a hundred.
- Keep every failure as a regression test that runs on every release.
Why we bother
Waymo’s 271 million miles and a well-run scenario programme are, in the end, two answers to the question RAND asked in 2016: how do you know it is safe? One answers it with experience on the road. The other answers it by imagining the road’s worst moments ahead of time, and checking them over and over. Most of the industry will need both, and for most teams the second is where the work starts.
Most of this post has been about tools: file formats, parameter sweeps, search methods, reference models. Underneath them is a much simpler idea. Every scenario in a catalogue started with someone picturing a real person in trouble. A child running out after a ball. A scooter squeezed between a bus and a lorry. A driver who looked at their phone at the wrong moment. The tooling is there so that each of those people is thought about thousands of times in simulation before an automated car ever meets them on a real road.
That is also why honesty matters so much in this work. A dashboard full of green ticks is reassuring, and it is tempting to stop there. The more useful question is the uncomfortable one: what haven’t we tested yet? A good scenario programme keeps asking it, keeps feeding in what it learns from the road, and is open about where its evidence runs out. Regulators now expect this, but the better reason is that the people sharing the road with these systems never signed up to be part of the test.
There is a local side to this for us as well. Indian roads are among the most varied anywhere, and they are thinly represented in the data most of the industry learns from. Building scenarios that reflect how people here actually drive, walk and ride is work we care about, because these are the roads we use every day.
Our ADAS verification team at Vayavya Labs does this work day to day. We build scenario libraries for ADAS and ADS verification, develop Euro NCAP and NHTSA-specific scenarios, evaluate coverage and KPIs, and set up system-level software-in-the-loop with virtual ECUs. If you are building a scenario pipeline and want to compare notes, get in touch.